The concept of trading level support and resistance is the most discussed in the technical analysis of assets, including crypto assets.
In analyzing chart patterns, traders often use the terms to describe price levels on charts that tend to act as barriers, preventing the price of an asset from getting pushed in a specific direction.
Key Takeaways
• Using support and resistance levels, Technical analysts can identify the price points on a chart where the probabilities favor a pause or reversal of a prevailing trend.
• Support occurs where a downtrend is foreseen to halt and resistance occurs where an uptrend is expected to pause temporarily.
• Market psychology also plays a vital role as traders and investors reference historic trends and react to changing conditions to anticipate future market movements.
• Using trendlines and moving averages, support and resistance areas can be identified on charts.
Support and resistance apply to all financial markets, whether stocks, forex, gold, or cryptocurrencies.
It is a straightforward method used in analyzing a chart to determine three points of interest to a trader quickly. These points include:
1. Timing an entry into the market
2. The direction of the market
3. Establishing the points to exit the market at either a profit or loss
If a trader can satisfactorily answer these questions, they essentially have a trading idea.
Being able to identify the support and resistance levels on a chart, the trader can answer those questions.
It is worth noting that the explanation of these two terms may appear simple when you start as a crypto trader, but as you move to higher levels, you realize that resistance and support could take various forms making the concept a little bit more complex to master.
What Does Forex Resistance and Support Mean?
Support can be defined as the price level where a downtrend is being anticipated to pause because of a concentration of demand or interest in buying.
For example: Whenever the price of securities and assets goes down, the demand for its shares goes up, and this ends up forming what is referred to as the support line.
Now let’s take a look at what resistance means on a price chart.
Resistance results from selling interest when the prices go up, once the zone or area of resistance or support has been identified, those specific price levels will serve as potential entry or exit points.
The moment a price gets to the point of support or resistance, one of these two things will happen- it will either bounce back in the opposite direction from the resistance or support level or go against the price level and still proceed on that track until it hits the next resistance or support level.
The concept of support and resistance also assumes that, in the future, prices will stop at these levels or zones and that they represent a remembered psychological barrier for prices.
In making their timing, some traders solely believe that these zones of resistance and support are not broken with ease.
So, it does not matter if the price has been frozen by either the resistance or support level or if it breaks through; traders can “bet” on a specific direction and will be able to determine if they are correct quickly.
If the price moves in the wrong direction, the position can quickly be closed, and only a small loss will have been made.
However, if the price moves in a good direction, that move will be substantial.
Frequently Asked Questions(FAQs)
Why do Support and Resistance Occur?
Did you ever buy a coin, watched it decline in price, and hoped to sell out for what you initially paid for it? Or have you ever sold a coin, watched it go up after you sold it, and wished you had the opportunity to repurchase it?
Well, you are not alone. There are common human reactions, and they show up on the price charts by creating support and resistance.
What are Round Numbers?
Round numbers often represent support and resistance levels. It is where buying and selling typically increase.
The tendency to look for rounded numbers is part of human psychology. This is why retailers use prices like $19.95 rather than $20. People subconsciously associate with the number 19 rather than 20.
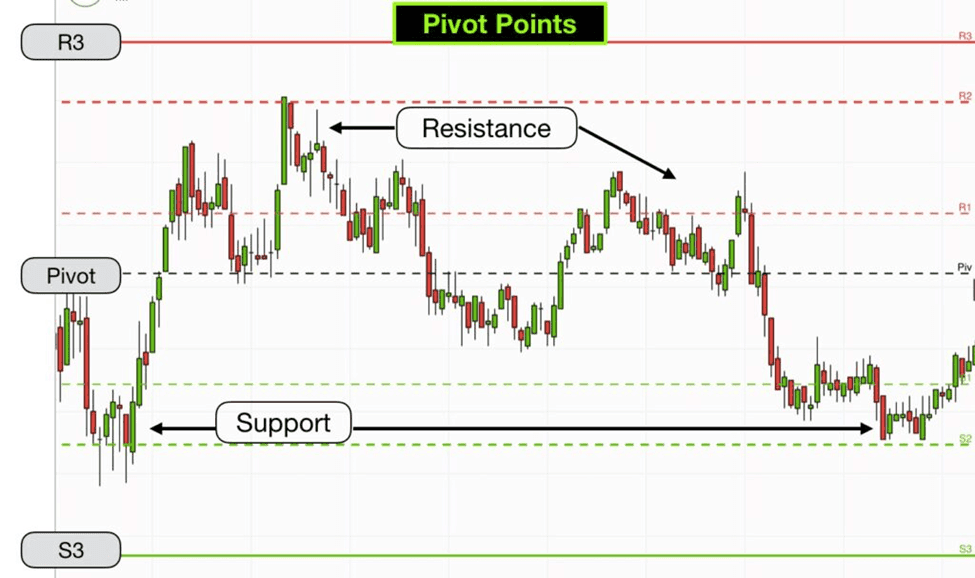
How Do You Find a Strong Support and Resistance?
Finding these key levels can be tricky.
Generally, a support area forms around the previous price lows, while a resistance area forms around the previous price highs.
Once an area of support or resistance has been identified, those price levels can serve as potential entry or exit points.
Here’s how to trade breakouts.
A price break above the resistance zone implies that sellers are satiated at that level, and buyers are anxious.
If another resistance zone exists above the one that was just broken, prices will typically trade up to that next higher zone.
Thus, a resistance zone in an advancing market can become a price objective once a lower resistance zone is broken. This logic also works with support zones in reverse.
Final Thoughts
Understanding support and resistance level are very important. Whether you’re day trading or swing trading, support and resistance are the fundamental concepts you need to understand in technical analysis. Think of support as a floor for price, while resistance acts as the ceiling.
Different forms of support and resistance exist, and some are based on the interaction of price with technical indicators.
As earlier stated, there are several methods to choose from when looking to identify support/resistance.
Even though the most reliable support and resistance areas tend to be the ones that are confirmed by multiple strategies, the goal remains the same— to prevent the price of an underlying asset from moving in a specific direction.


Read More