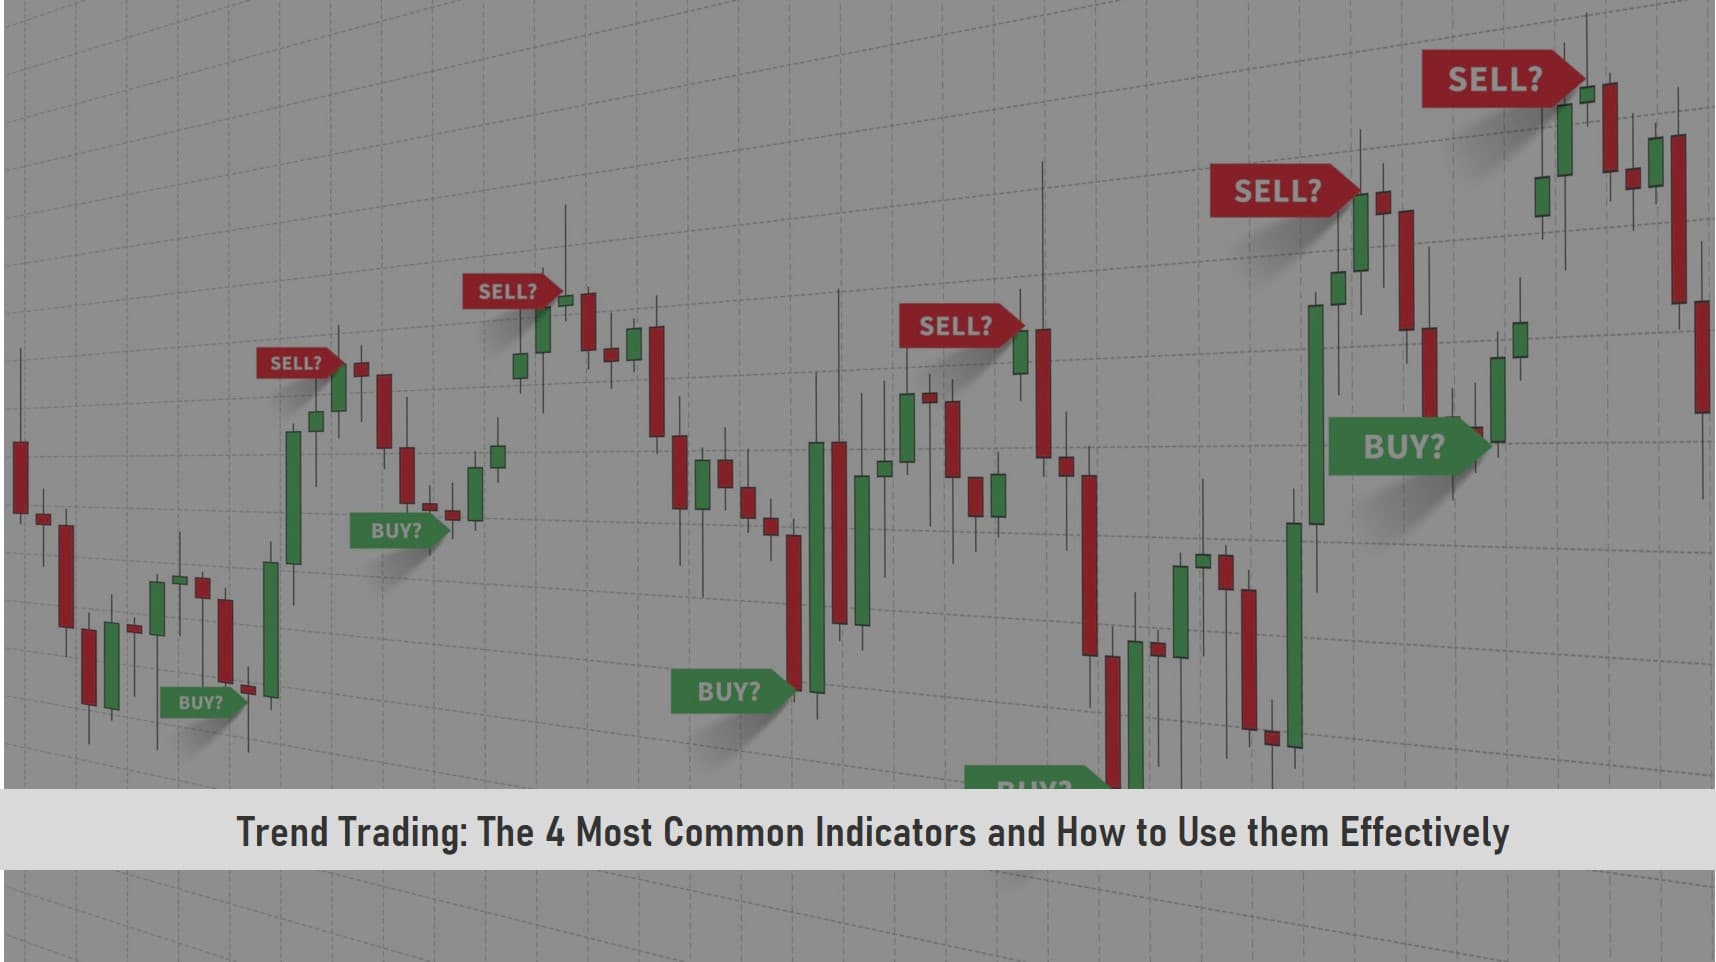
Trend Trading: The 4 Most Common Indicators and how to use them effectively
Most profitable trades can be spotted using just 1 of 4 chart indicators. But it is ideal to understand how all 4 indicators work.
These indicators are:
- Moving Averages
- Relative Strength Index Oscillator
- MACD (Moving Average Convergence Divergence)
- Stochastic Oscillator
Once you understand how to implement these common indicators, you should execute better trades.
Let’s review these indicators…
SEE ALSO: What is Fibonacci Retracement and How to Use It
SEE ALSO: Best Volatility Indicators You Should Consider in Forex
SEE ALSO: Beginners Guide – 8 Day Trading Indicators for Currencies and Stocks
Moving Averages
This Forex indicator allows you to learn forex trading using daily charts. A trade idea can be generated only by adding some moving averages to the chart and this technical analysis tool levels up price data by setting a continually updated mean price.
Across a price chart, this indicator makes one, flat line that eliminates outrightly any variations as a result of random price changes. The mean is observed over a particular period, 20 minutes, 20 days, 30 weeks, or whenever the trader decides to.
For dedicated trend followers and investors, the 100-day, 200-day, and the 50-day simple moving average is an ideal choice.
There are lots of ways to use the moving averages.
First, view the angle of the indicator. If it mainly moves horizontally for a long period, then the price is ranging, not trending. A trending range exists when a currency trades amid continually high and low prices over a period.
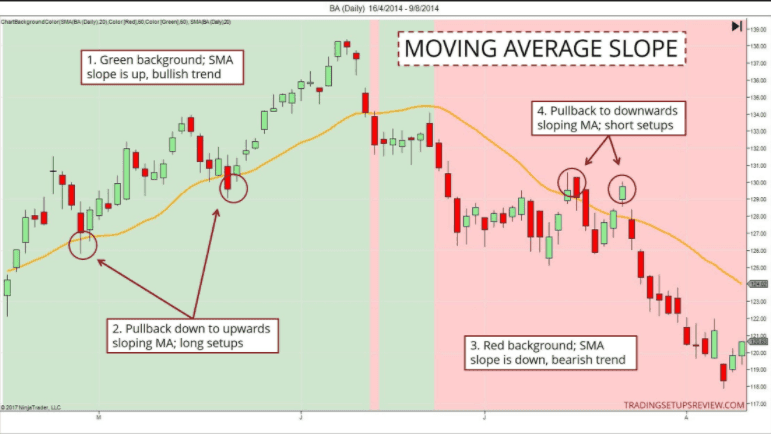
When the moving average is cornered up, an uptrend is about to occur. Though, the moving average doesn’t make speculations about the upcoming value of a stock or currency; they just show the effect the price has, averagely, over a period.
Crossover is an additional way to use moving averages. It’s applied by plotting a 200-day & 50-day on your chart, a buy signal appears when the 50-day moves over the 200-day.
A sell signal happens when the 50-day goes lower than the 200-day and the time interval can be modified to fit your trading time interval.
Spotting trade opportunities with moving averages enables you to see and trade beyond momentum by opening trades when the currency pair goes in the direction of the indicator and closing when it moves in the opposite direction.
SEE ALSO: Choosing a Forex Third Party Signal Without Regrets
The RSI Oscillator
The RSI is also known as the Relative Strength Index is an indicator that is straightforward and assists traders while trading. An indicator like the RSI helps in determining when a fiat currency is overbought or vice versa, so a reversal is possible.
For traders that prefer to “buy low and sell later”, the Relative Strength Index may be your best fit. This indicator can as well be employed in trending/ranging markets to spot remarkable entry and exit prices.
When markets do not have a precise movement, it shows more vividly the direction to trade (an advantage of trend trading) and you’ll only prefer to join the trend when the Relative Strength Index is coming off at extremes.
As the Relative Strength Index is an indicator, it is tabulated with values from 0 to 100 and the value of 100 is viewed as overbought and a reversal towards the downside is probable whereas the value of 0 is viewed as oversold and a reversal towards the upside is imminent.
If you find an uptrend, you would like to spot the Relative Strength Index reversing from readings less than 30 or oversold before entering again in line with the trend movement.
While most overbought & oversold levels can be accurate in most cases, they might not offer the latest signals to trend traders. You can then choose to buy next to oversold when the trend goes up and open a short trade close to an overbought condition during a downtrend.
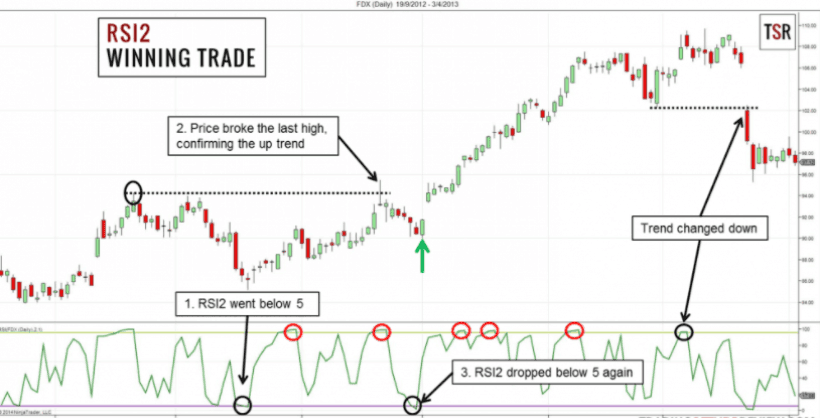
For instance, assuming the long-term trend of a stock goes up. A buy signal appears when the Relative Strength Index goes below 50 and then above it again. This means a price reduction has been experienced.
The trader then buys immediately the pullback seems to have stopped and the trend is back again.
SEE ALSO: 5 Best Scalping Forex Robots for MT4
SEE ALSO: The ABC of Forex Robots and How They Really Work
SEE ALSO: Advantages and Disadvantages of Using Forex Robots
MACD (Moving Average Convergence Divergence)
The Moving Average Convergence Divergence (MACD) is sometimes referred to as the father of oscillators and can be used effectively in trending/ranging as a result of the moving averages it uses that offers an obvious display of fluctuations in momentum.
MACD is like an oscillating indicator as it goes beyond and below 0. It is a trend-tailored and momentum oscillator and a major strategy employed here is to check the angle of zero the MACD lines lie on the histogram under the chart.
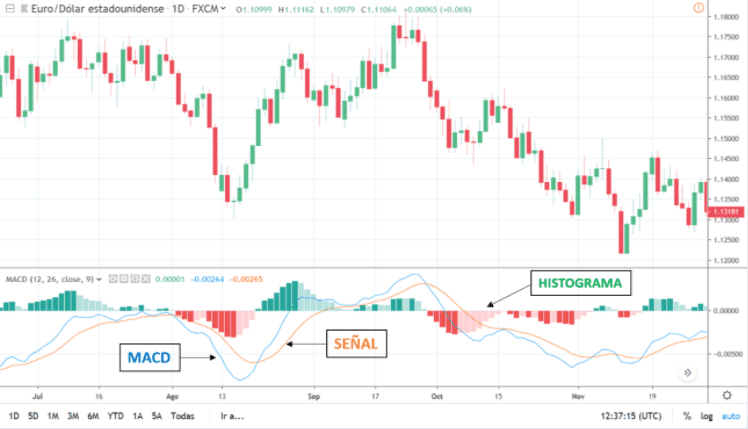
If the MACD lines are beyond zero for a long period, the stock is possibly going upwards. At the same time, if the MACD lines are under zero for a long period, the trend is probably down.
With this strategy, probable buy signals appear when the MACD goes beyond zero and probable sell signals when it crosses less than zero.
Upon identify the market scenery as ranging or trading, there are 2 things you have to watch for to get signals from the MACD. Firstly, is to find the lines with regards to the zero line that identifies an upward or downward bias of the trading pairs.
Secondly, you wish to spot a crossover/cross under the Red line to the signal line for a buy/sell trade, accordingly. Like every indicator, the Moving Average Convergence Divergence works best with a recognized trend or range-bound trading condition.
Immediately you spot the trend, it is advised you take crossovers of the indicator line towards the movement of the trend. When the trade is entered, you can set stops under the latest price extreme ahead of the crossover and place a trade barrier 2x the amount you’re trading.
The Stochastics Oscillator
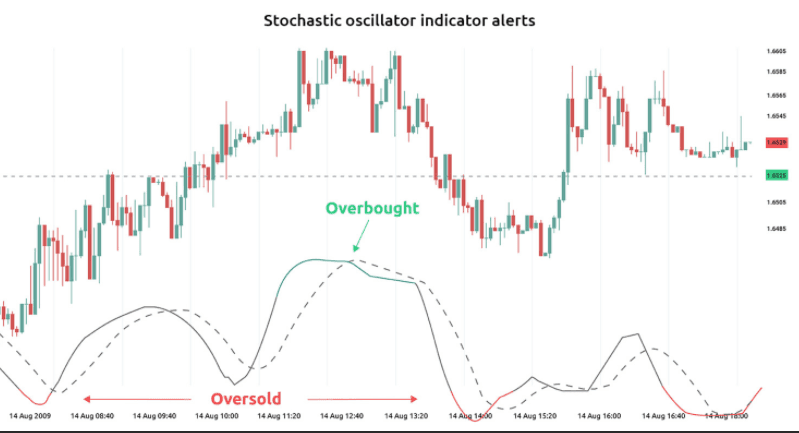
Slow stochastics are indicators similar to the RSI that can assist with identifying overbought/oversold trading conditions, possibly creating a price reversal. The exciting part of trading with the stochastic oscillator is the two lines, %K & % D line that signals entry to the market.
As the indicator has a similar reading for the overbought/oversold, you just identify the %K line to move over the %D line via the 20 level to spot a strong buy signal towards the movement of the trend.
SEE ALSO: Day Trading Strategies for Beginners
SEE ALSO: 7 Best Currency Pairs to Trade for Beginners
SEE ALSO: What are the Best Days of the Week to Trade Forex?
How to Read Charts of Different Market Conditions Using Fx Indicators
Several factors come in when comparing the value of one currency to another. A lot of traders choose to view charts as an easy way of spotting trading opportunities with the aid of forex indicators.
When looking across a chart, you’ll find two regular market conditions. Both environments are either ranging markets with a solid support and resistance level or a trending condition where the price is gradually going up or down.
With the aid of technical analysis, you can spot range-bound or trending conditions as a trader and then identify better likely entries or closes according to the readings.
Indicators can spark up price information, as well as offer trend signals and warnings concerning reversals. They can be employed on every timeframe and most times, indicators provide variables that can be modified to fit any trader’s preference.
Image credit: olymptrade.broker


Read More