Introduction to Forex Charts
Trading the Forex market requires the use of specialized tools. Forex charts are basic tools required in technically analyzing the market before trading.
There are several types of forex charts but we will discuss the 3 main charts you’ll come across while trading. Many Forex brokers adopt them on their trading platform.
The three types we’ll discuss are namely — the Line Chart, the Bar Chart, and the Candlestick Chart.
Our discussion about the types will border on — what they are, how to read them, their merits, and their demerits.
The Line Chart
Introduction: What Is a Line Chart?
We all know the general definition of a chart in forex. It is a graph that shows the exchange rates of a currency pair over a period.
However, in differentiating the 3 types of charts from one another, two things differentiate the line chart.
The first thing that differentiates the line chart is how many rates per time get shown. (By “time”, I mean the minutes or the days or the months, etc featured in the chart.)
For each time in a line chart, just 1 rate per time gets shown. This is in contrast to the bar chart and the candlestick chart which both show 4 rates per time.
SEE ALSO: Beginners – Forex Lots and Pips Simplified
SEE ALSO: Support and Resistance in Forex Trading – Simplified
For instance, let’s assume a EUR/USD line chart features 4 times (January, February, March, and April). In the chart,
- something like 1:1.20290 may be what will be shown for January;
- something like 1:1.20170 may be what will be shown for February;
- something like 1:1.20327 may be what will be shown for March; and
- something like 1:1.20086 may be what will be shown for April.
But if it were a bar chart or a candlestick chart,
- January alone will have multiple rates, like — 1:1.20290, 1:1.20161, 1:1.20140, and 1:1.20292;
- February alone will have multiple rates, like — 1:1.20190, 1:1.20260, 1:1.20210, and 1:1.20000;
- March alone will have multiple rates, like — 1:1.20250, 1:1.20293, 1:1.20296, and 1:1.20291; and
- April alone will have multiple rates, like — 1:1.20290, 1:1.20290, 1:1.20290, and 1:1.20290.
The second thing that differentiates the line chart is that — the rate included for each time is the time’s closing rate.
For instance, if the following are the exchange rate of the EUR/USD for January —
Day 01 — 1:1.20290;
Day 02 — 1:1.20297;
Day 03 — 1:1.20298;
Day 04 — 1:1.20297;
Day 05 — 1:1.20299;
Day 06 — 1:1.20297;
Day 07 — 1:1.20297;
Day 08 — 1:1.20295;
Day 09 — 1:1.20285;
Day 10 — 1:1.20281;
Day 11 — 1:1.20282;
Day 12 — 1:1.20285;
Day 13 — 1:1.20279;
Day 14 — 1:1.20282;
Day 15 — 1:1.20282;
Day 16 — 1:1.20285;
Day 17 — 1:1.20285;
Day 18 — 1:1.20282;
Day 19 — 1:1.20281;
Day 20 — 1:1.20279;
Day 21 — 1:1.20278;
Day 22 — 1:1.20277;
Day 23 — 1:1.20280;
Day 24 — 1:1.20272;
Day 25 — 1:1.20273;
Day 26 — 1:1.20274;
Day 27 — 1:1.20281;
Day 28 — 1:1.20286;
Day 29 — 1:1.20287;
Day 30 — 1:1.20293; and
Day 31 — 1:1.20300…
then 1:1.20300 (the rate for January 31) is what will be set down in the line chart, for January.
The rate of the last day of each other months, is also what will be set down.
NOTE: I write exchange rates like this: 1:1.20300, but in many charts, rates are simply written like this: 1.20300.
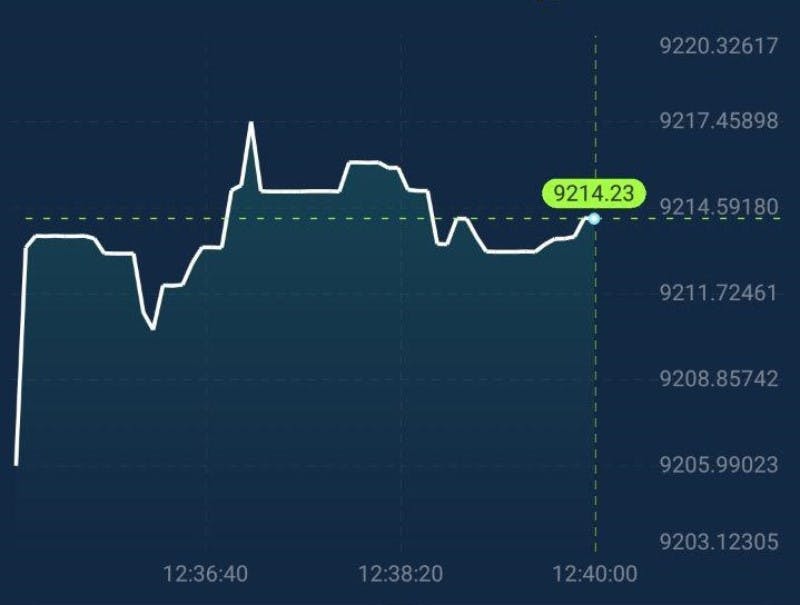
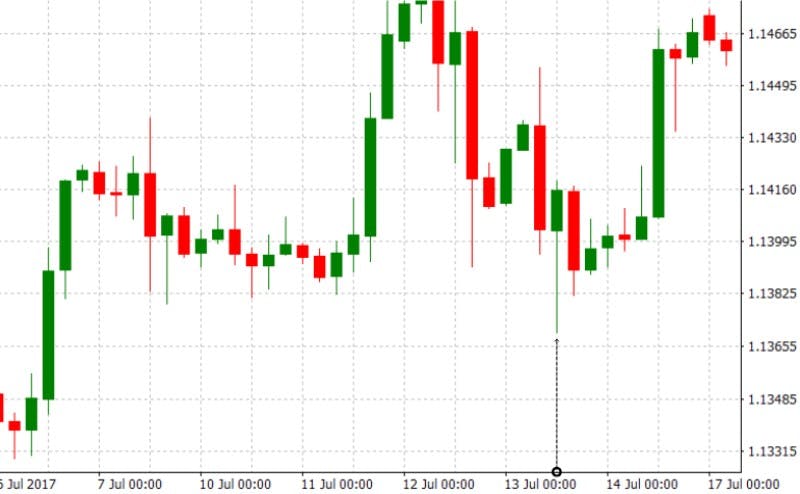
How To Read a Line Chart
To be sure we’re on the same page, reading a line chart means getting the closing exchange rate of a particular time, from the chart.
So, to read a line chart —
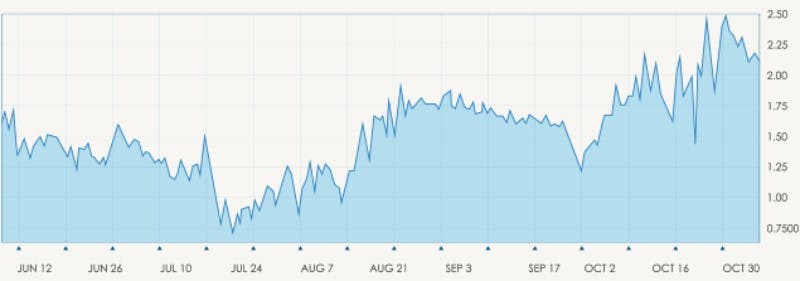
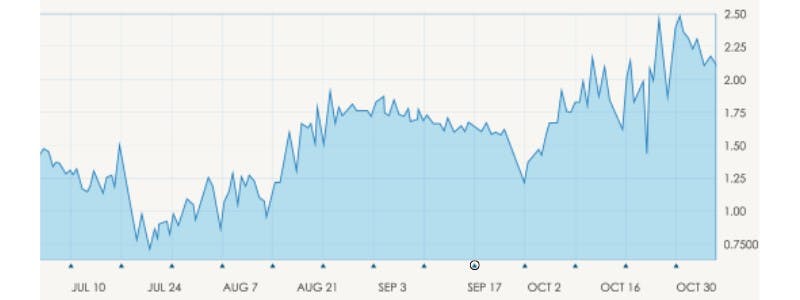
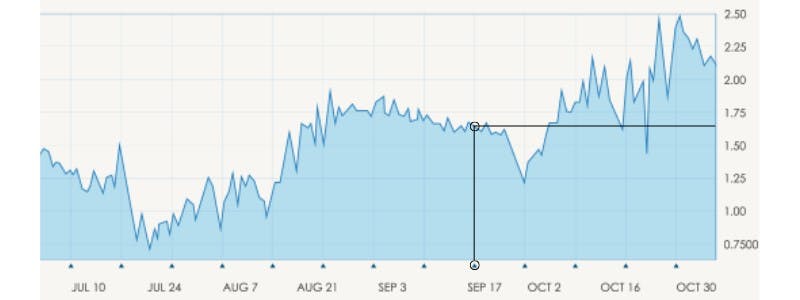
Step 1: Locate the position of the time on the x-axis of the chart.
If you’re trying to get the rate for September 17 from a line chart that features some days of a year, then locate where September 17 falls on the x-axis.
Step 2: From the position of the time (on the x-axis), produce a perpendicular straight line upwards.
Produce the line until it meets the exchange rate line.

SEE ALSO: 5 Best Scalping Forex Robots for MT4
SEE ALSO: Advantages and Disadvantages of Using Forex Robots
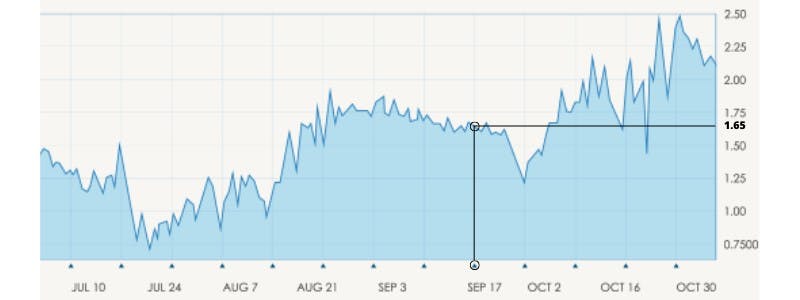
Step 3: From the meeting point, produce another straight line, to the y-axis on the right.
This second straight line must be perpendicular to the second y-axis.
Step 4: At this point, what’s left is to check for the value of the new meeting point.
By “new meeting point”, I mean where the second straight line meets with the second y-axis.
The value of the point will be your reading.
The Merits of a Line Chart
The major merit of the line chart is its simplicity. Its simplicity makes it easy for beginners to quickly understand it.
The simplicity also makes it easy to focus on the way the rate of a currency pair changed over time.
The Demerits of a Line Chart
The demerit of the line chart is its simplicity. Yes, the simplicity is good, but it is also sometimes undesirable.
Being simple means that when you want more than one exchange rate for each time on a chart, the line chart won’t be very helpful.
The Bar Chart
Introduction: What is a Bar Chart?
The bar chart shows multiple exchange rates for each time featured in it. The rates that get communicated for each time are… its opening rate, its highest rate, its lowest rate, and its closing rate.
This is in contrast to the line chart which communicates only the closing rates of its times.
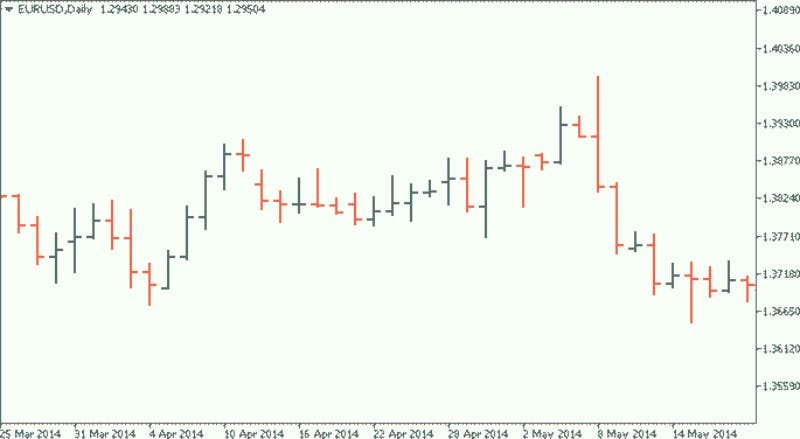
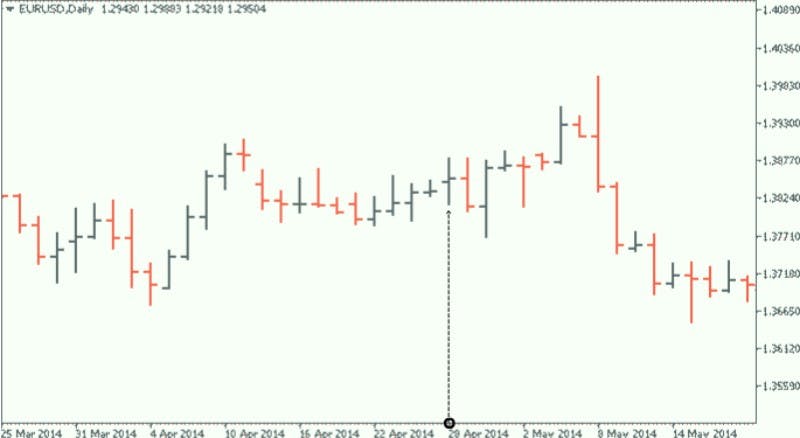
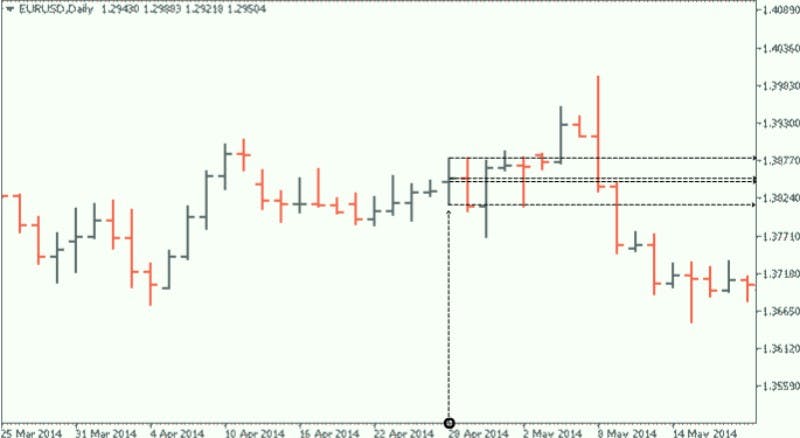
(A bar chart.)
How To Read a Bar Chart
Step 1: Determine what time you’ll like to read.
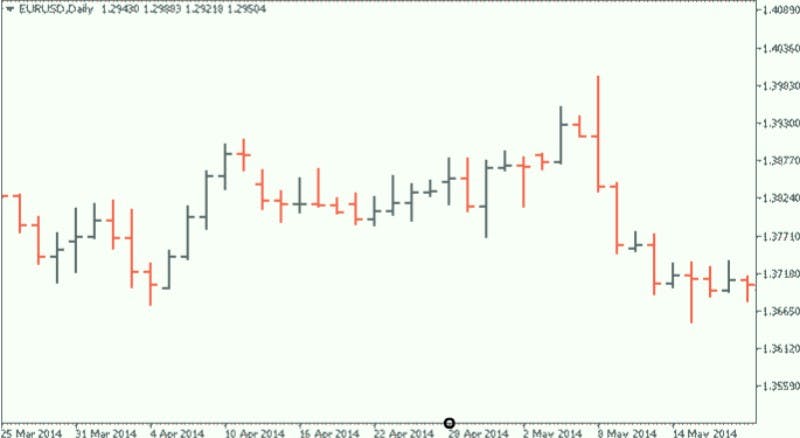
Step 2: Locate the bar that’s directly on top of “the position of that time, on the chart”.
A single bar is like what we have below.
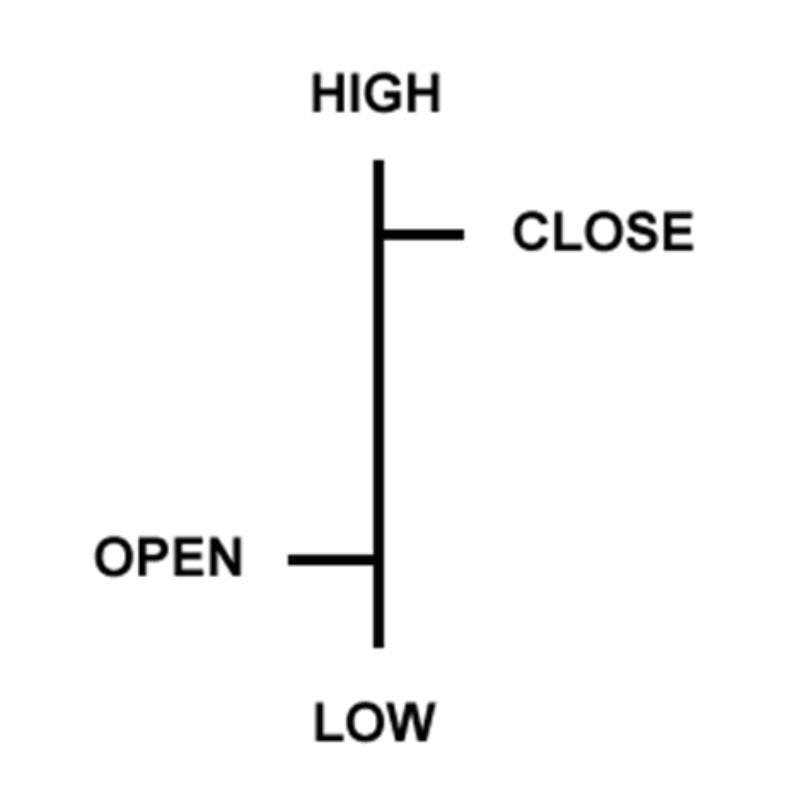
The two extensions on the two sides are called hashes.
To locate the bar of the time you’re interested in.
Step 3: After you must have located the time’s bar, extract the rates from it, by interpreting it.
Interpreting a Bar Chart

The opening rate: In the middle of the left hash, the value of its price level is the opening rate.
The highest rate: At the top of the bar, the value of its price level is the highest rate.
The lowest rate: At the bottom of the bar, the value of its price level is the lowest rate.
The closing rate: In the middle of the right hash, the value of its price level is the closing rate.
SEE ALSO: Master Price Action in Forex with these Simple Steps
SEE ALSO: 7 Best Currency Pairs to Trade for Beginners
The Merits of a Bar Chart
The major merit of the bar chart is that it carries more information. It can tell the opening, highest, lowest, and closing rates of each time.
This will sometimes be better than the line chart which communicates only the opening rate of each time.
The Demerits of a Bar chart
The merit of the bar chart is also its demerit. While communicating more information can be helpful, it also has its demerit. Too much information makes it harder to focus on just “the way a pair’s rate changed over time”.
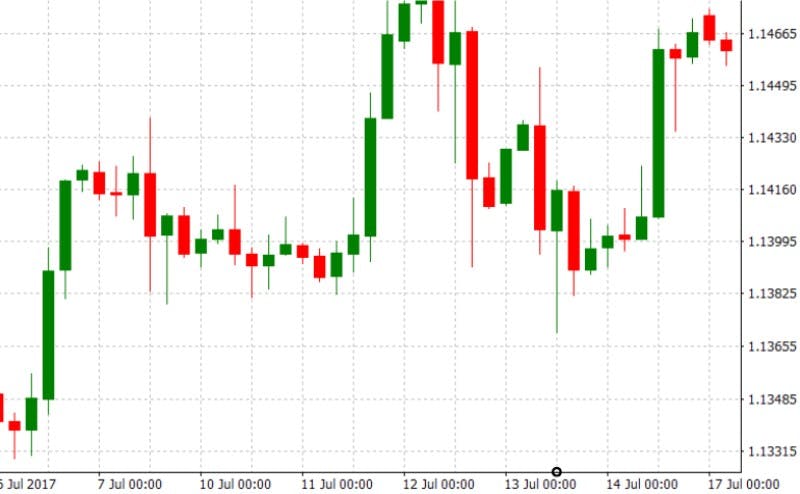
The Candlestick Chart
Introduction: What is a candlestick chart?
The candlestick chart is similar to the bar chart. It communicates multiple exchange rates for each time featured in it.
The rates communicated are — the opening rate, the highest rate, the lowest rate, and the closing rate.
However, unlike the bar chart, the candlestick chart communicates its information with a candlestick-like figure.

How To Read a Candlestick Chart
Step 1: Determine what time you’ll like to read.
Step 2: Locate the candlestick that’s directly on top of “the position of that time, on the chart”.
Step 3: After you must have located the time’s candlestick, extract the rates from it, by interpreting it.
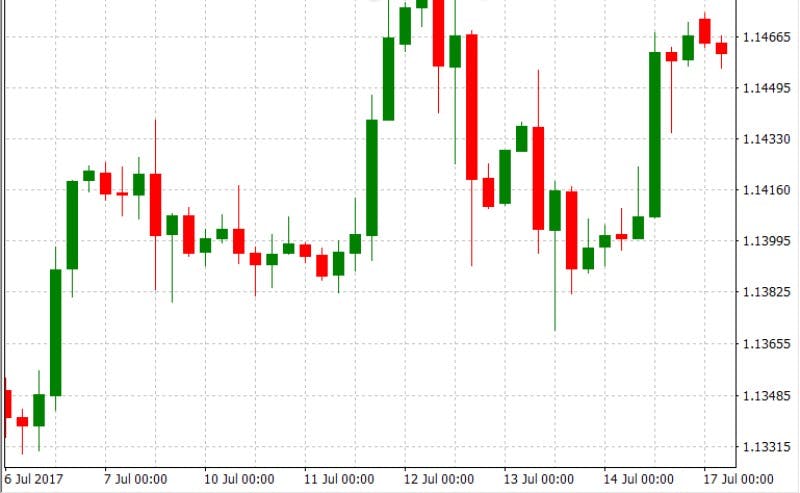
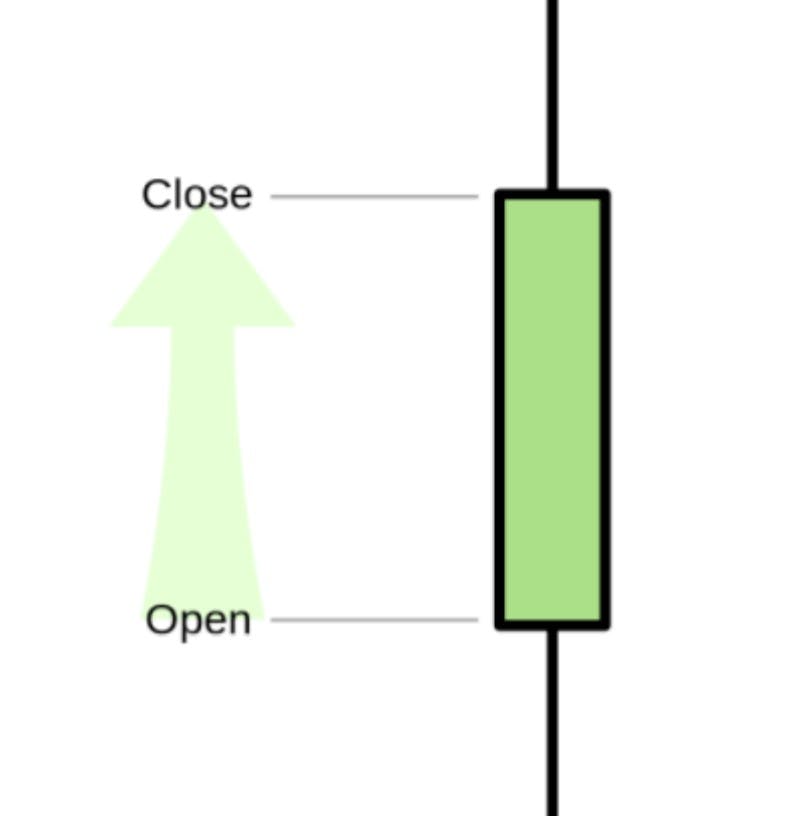
Interpreting a candlestick
If the candlestick is green, then the opening rate is the value of the price level at which the candlestick’s bottom is.
For the closing rate, its value is the value of the price level at which the candlestick’s top is.
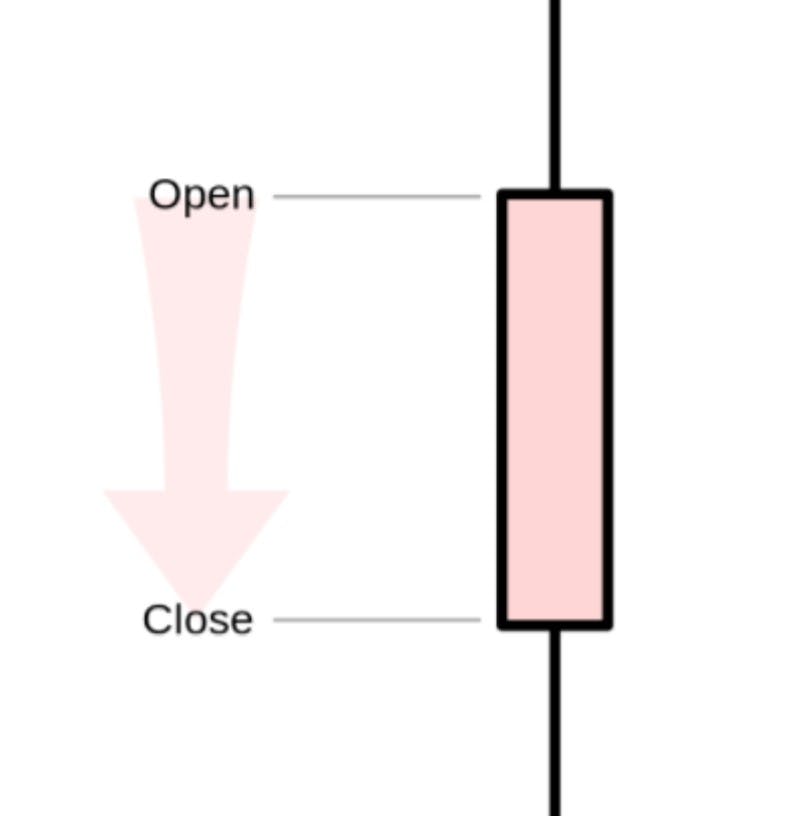
However, if the candlestick is red, then the opening rate is the value of the price level at which the candlestick’s top is.
For the closing rate, its value is the value of the price level at which the candlestick’s bottom is.
The highest rate: The value of the price level at which the tip of the top wick is.
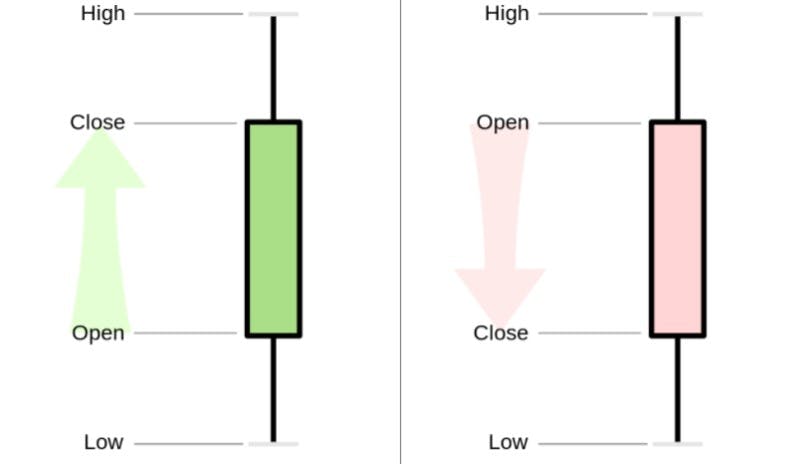
The lowest rate: The value of the price level at which the tip of the bottom wick is.
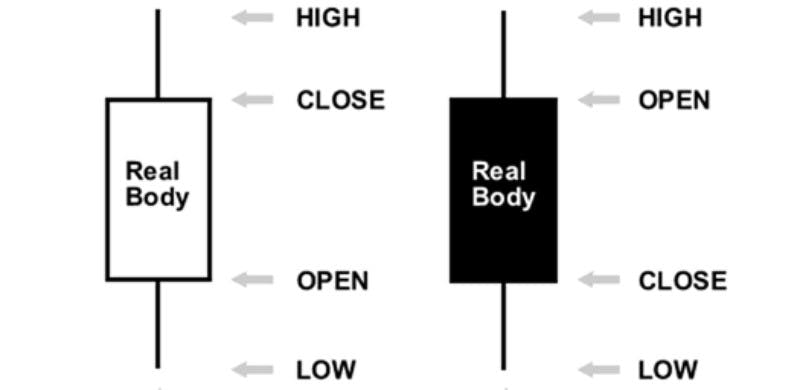
NOTE: There are times when white candlesticks are used in the place of green sticks. Also, when such is done, black candlesticks are further used in the place of the red ones.
The Merits of a Candlestick Chart
The candlestick chart has the same merit as the bar chart. It carries more information. It can tell the opening, highest, lowest, and closing rates of a time.
The candlestick stick has another merit. Working with it is more fun. The sticks are easier to spot and focus on. The sticks are also aesthetically pleasing.
SEE ALSO: Learn to Trade Currencies with Confidence
SEE ALSO: What are the Best Days of the Week to Trade Forex?
The Demerits of a Candlestick Chart
The candlestick chart has the same demerit as the bar chart. Its merit is also its demerit.
Too much information makes it a little harder to focus on just the way a pair’s price changed over time.
The candlestick chart has another demerit. Because candlesticks are bigger, compared to bars, a candlestick chart will take a timeframe of a smaller range, compared to a bar chart.
Final Thoughts
While this content carefully explains how to read forex charts, I’m going to suggest something additional. I will suggest that you further practice chart reading as soon as possible.
By practicing, you’ll be able to read and analyze forex charts better.


Read More