The truth is, everyone is looking for the “holy grail” that takes away the anxiety that comes with knowing how to trade without indicators.
As you may already know, this creates a love-hate relationship with indicators when nothing meets your expectations.
This evolves into a hunt for the “perfect indicator”, which wastes a lot of time and energy.
Well, at some point on your trading path you will surely think: “I want to learn to trade without indicators!”
Let’s know what price action means…
Price Action
Price action is simply plotting the price movement of a currency pair, stock, or security over time, it forms the basis of all technical analysis.
Becoming good in your technical analysis is the ability to read a candlestick chart free of indicators.
In this article we’ll examine 3 steps that will guide you towards indicator-free trading.
Key Takeaways
• Understanding the structure of the market is basically to see which direction prices of instruments are moving. This is critical to choosing a strategy.
• Intuition in trading should not be disregarded even with the best trading indicators.
• The best trading indicators may not read and analyze Breaking News, economy and other macro-economic fundamentals.
• Being able to study, analyze and implement successful trades is a function of continuous learning and trading.
SEE ALSO: Beginners Guide – 8 Day Trading Indicators for Currencies and Stocks
Let’s examine steps to trade without indicators.
Step 1: Read the market structure when analyzing charts
Step 2: Identify high-probability turning points
Step 3: Wait for a trading signal
Step 1: Read the Market Structure When Analyzing Charts
We believe that one of the main flaws in the decision process of many traders is the inability or neglect to read the market structure before pulling the trigger.
Understanding the structure of the market is basically “syncing up” with it to see which way the wind is blowing.
It is something so basic that many sometimes they simply stop doing it, they lose the habit.
Although market structure is the basics of technical analysis, it is very important. You will need it in each of your trading decisions.
It consists of interpreting the formation of the maximum and minimum points of the price on the chart.
The order in which the new highs or lows occur can give you a solid foundation for determining where the market is moving.
Basic structure analysis helps you identify things that most traders struggle with Price action can tell you if a market is:
- In an uptrend
- In downtrend
- In the range between two levels
- Emerging into a new trend
- Forming a major floor or ceiling
- Identifying the structure of the trend
The Same Question Often Arises: How do I Identify a Trend?
This is such a simple hurdle but still prevents many traders from advancing with their chart-reading skills. Many try to use complex indicators to tell them when a market is trending.
That is completely unnecessary. Don’t rely on indicators to tell you if a market is trending or not. You will only need a few seconds if you follow this simple rule.
“A trending market is one that is making higher highs and higher lows or one that is making lower lows and lower highs.”
It seems too simple to be true, right? But trust us, that’s all you need to look for to identify trending conditions.
Step 2: Identify High Probability Turning Points
After reading the situation on your chart, you should already know in which direction you want to trade. The next thing is to find the point at which the price is most likely to make a turn.
This is when technical analysis comes into play and we start to use horizontal levels and trend lines.
To start putting together a high-probability, high- quality trade, you must find the places that have proven to be, from a logical point of view, catalysts for price turns.
We know that anything can happen in forex, but here are 2 highly probable scenarios;
- Price pulls back towards the old support, uses it as a new resistance, and makes a turn there.
- Price continues to decline towards the next major support level, where it is very likely that we will see the price turn around, or at least “bounce”.
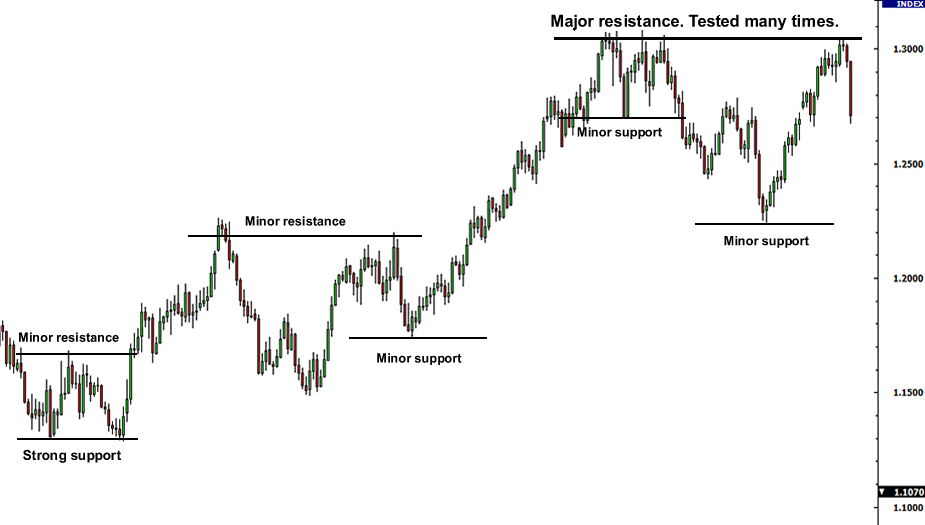
Here we identify uptrend conditions and mark important support and resistance levels to look for potential turning points.
We can see that the current price position is bad enough to enter the trend with a buy.
Thus, by not having the patience to wait for a better price, many traders lose their money by incorrectly entering the trend.
They think, “Well the trend is bullish so I’ll start buying.” This is called chasing the price, buying in a bad position.
This is where “buy low, sell high” comes into play. What this phrase implies, is to use the pullbacks within the trends to our advantage, so that we can enter at a smart price.
In some cases horizontal support and resistance levels do not make much sense, here you may need to adopt dynamic levels or trend lines.
In some cases horizontal support and resistance levels do not make much sense, here you may need to adopt dynamic levels or trend lines.
Step 3: Wait for a Trading Signal
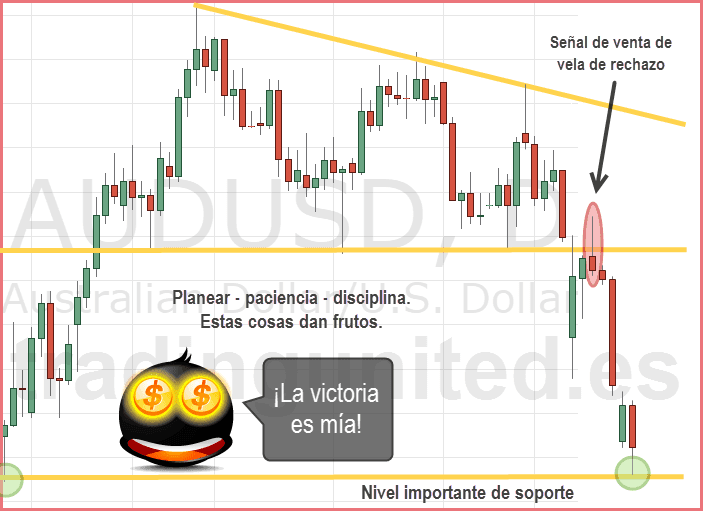
The final piece of the puzzle is waiting for a buy or sell signal provided by your trading system. If you trade clean charts, these signals are most likely to come in the form of candlestick patterns.
The most common pattern is the rejection candle, and one of the best to learn to trade without indicators.
This is what could happen if you skip these 3 steps or don’t include them in your technical analysis:
- Market Structure: If you neglect to read the market structure, you could simply enter very bad markets and get caught in turbulent conditions.
- Identify Potential Turning Points: Many traders enter the market in bad positions, such as selling low or buying high for not doing this.
- Trading Signals: Some traders do something called “touch trading”, which is blindly buying or selling in the market without any signal. This might work if you’ve done steps 1 and 2 correctly but having a trade signal basically confirms the idea and gives it a better chance of working.
Write these steps down on paper or include them in your trading plan. This will help you simplify your trading and stay away from those bad signals or impulsive decisions.
SEE ALSO: What You Should Know About Naked Trading Price Action
Frequently Asked Questions (FAQ)
1. Do You Need Technical Indicators to Trade?
No. At the same time, they can provide you with strong analytical support and enhance the results of your performance. This makes technical indicators worth studying and using.
2. Which Chart is Best for Trading?
For most stock day traders, a tick chart will work best for actually placing trades. The tick chart shows the most detailed information and provides more potential trade signals when the market is active (relative to a one-minute or longer time frame chart). It also highlights when there is little activity.
3. Do Professional Traders Use Indicators?
Professional traders combine market knowledge with technical indicators to prepare the best trading strategy. Most professional traders will swear by the following indicators. Indicators offer essential information on price, as well as on trend trade signals and give indications on trend reversals.
4. Why do Technical Indicators Fail?
Technical indicators fail because nothing in trading is 100%. Technical analysis and technical indicators do work once you take responsibility for your trading decisions. Remember, you do not have to take every trade.
Final Thoughts
Naked Trading can be a nice experience so long as you understand the market trends. If you are very much capable of identifying a trend then by all means, this is for you.
It is important that you also understand the market structure and the potential turning points to avoid you entering into bad markets.

Read More