When we talk about naked trading (trading naked), we mean the use of trading without indicators, i.e. trading based on price action with nothing.
The main argument for operating without indicators is the fact that every indicator is the result of a mathematical operation on the price and, therefore, the price itself should better reflect what has happened and what can happen in the market.
Key Takeaways
•You can have a bullish bar whose closing price is lower than the opening price; in the same way, you can have bearish bars in which the closing price is higher than the opening price.
•There comes a time when a new maximum appears that is higher than the previous maximum, the first HH or higher high.
After this first HH, a minimum appears that is greater than the previous minimum (HL) and a succession of HH and HL begins, characteristic of upward trends.
It should be noted that the drawing of trend lines, Fibonacci, chart patterns, and support/resistance lines are not considered technical indicators in themselves and are widely used in naked trading.
What is Price Action?
This is a very frequent question among new traders. Even when it is explained that it is price action, one can be left with the feeling that it is something very heterogeneous. Price action is just that, what price does.
The way to see the price action in the purest way is to observe the tick charts, but trading on these charts is quite complicated, to facilitate the work, the tick charts are transferred to charts in which we group the ticks in intervals, time creating the bar, candlestick, or line charts that we are used to working with.
Some examples of price action are highs and lows of swings or supports and resistances and the test of these levels.
SEE ALSO: Master Price Action in Forex with these Simple Steps
SEE ALSO: What You Should Know About Naked Trading Price Action
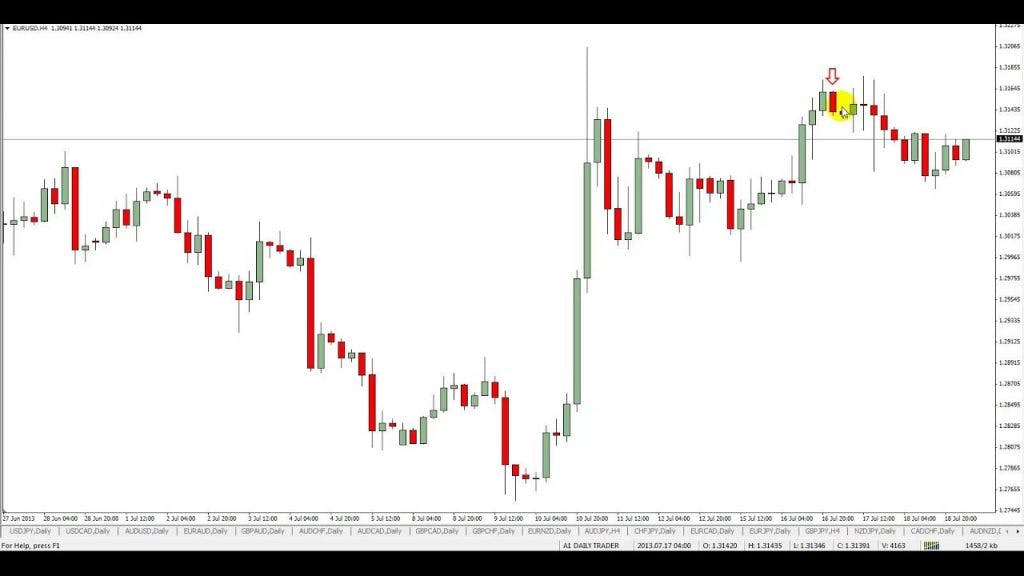
Bars Based on Price Action
When analyzing price action, it is very common to use bar charts. There are different types of bars depending on the behavior of the bar with respect to the previous one and their identification and analysis is of great help in the analysis of the price action:
Up Bar or Bullish Bar: it is a bar in which the maximum and minimum are greater than the maximum and minimum of the previous bar. That is, the bullish bar has a higher high and a higher low with respect to the previous bar.
Down Bar or Bearish Bar: analogous to the bullish bar, the bearish bar is one that has a lower high, and a lower low, in other words, a bearish bar has the maximum lower than the maximum of the previous bar and the minimum also less than the minimum of the previous bar.
Inside Bar or Internal Bar: It is a bar in which the maximum is less than the maximum of the previous bar and the minimum is greater than the minimum of the previous bar. The inner bar is “inside” the previous bar.
Personally, I do not consider an internal bar to be a bar in which the maximum or minimum is equal to the maximum or minimum of the previous bar, but there are traders who do, there is no consensus in this regard.
The inner bars are a reflection of indecision in the market. Some traders prefer to define the inner bar as one where the open and close (not the high and low) lie between the high and low of the previous bar.
Outside Bar or External Bar: The term enveloping bar is also used to refer to this type of bar. It is a bar whose maximum is greater than the maximum of the previous bar and whose minimum is less than the minimum of the previous bar.
SEE ALSO: A Beginner’s Guide – How To Analyze 3 Types of Forex Charts
SEE ALSO: 6 Psychological Pitfalls of Trading the Forex Market
In the outer bars we can have three cases. In the first case, the closing and opening of the bar are close together, the outer bar being “undecided”.
In the second case the closing price is in the upper third/quarter of the bar and the opening in the lower part; the engulfing bar is bullish.
In the third case, the opening is in the upper part of the bar and the closing in the lower third/quarter of the bar; the engulfing bar is bearish.
Some traders prefer to define an outside bar as one in which the closing and opening price, not the high and low, encompass the previous bar.
Note that according to the definitions given in the previous points, you can have a bullish bar whose closing price is lower than the opening price; in the same way, you can have bearish bars in which the closing price is higher than the opening price.
For this reason, keep in mind that these definitions use the maximum and the minimum and their relationship with the maximum and minimum of the previous bar, not closing and opening prices.
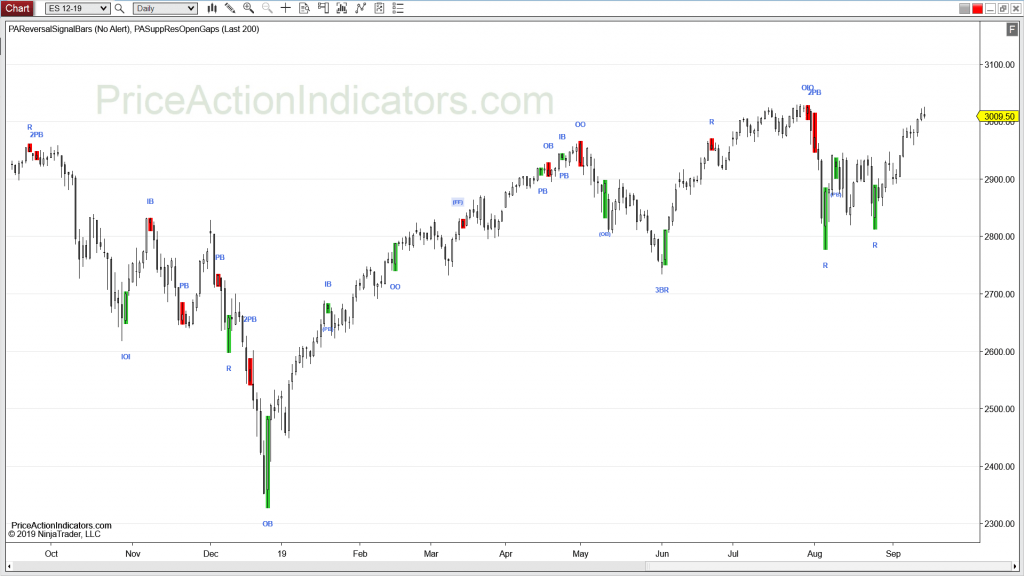
Identification of the Trend According to the Price Action
According to the price action, it can be very clearly defined what is the downtrend and what is the uptrend for a given time-frame by observing the highs and lows of the oscillations that the price is making.
Upward trend: If there is an upward trend, the price will carry out swings or oscillations, giving successively higher maximums (higher high – HH) and the minimums will also be successively higher (higher low – HL).
Bearish trend: Contrary to the uptrend, during a downtrend the price reaches lower and lower lows (lower low – LL) and lower and lower highs (lower high – LH).
Consolidation: If the price does anything else not described in the two previous points, we are in a consolidation period, being frequent in this phase to find graphic patterns such as triangles, rectangles, supports and resistances that define a range area, etc.
There comes a time when a new maximum appears that is higher than the previous maximum, the first HH or higher high.
After this first HH, a minimum appears that is greater than the previous minimum (HL) and a succession of HH and HL begins, characteristic of upward trends.
Once we have identified if we are in a trend phase and its direction, we can consider that trend as valid until the price action does not break the succession of HH and HL in an uptrend or the succession of LL and LH in a downtrend.
When the breakdown of this succession occurs, it is normal for the market to enter a consolidation period much easier to identify in lower time-frames than in the time-frame in which we are working.
During the consolidation period, the price will not follow the trend pattern described above; the highs and lows of the oscillation will not be successively higher or successively lower.
Frequently Asked Questions (FAQ)
1. What is Price Action Trading Best Suited For?
Price action trading is better suited for short-to-medium term limited profit trades, instead of long term investments. Most traders believe that the market follows a random pattern and there is no clear systematic way to define a strategy that will always work.
2. Can You Trade Stocks With Price Action?
Yes you can as you can use price action trading in most liquid markets. Some price patterns might work better in specific markets. Here, you will find detailed trading examples showing you how to apply price action in the stock market.
3. How do I Practice Price Action Trading?
If you want to practice price action trading, watching the market swings is great way to start. Following the ebbs and flows of the market is the best way to track the market trend.
Final Thoughts
Trend-lines, when combined with other strategies, can provide high probability signals to trades. Candles can be combined with support, resistance, Fibonacci levels, and various trend indicators. However, this powerful tool, like any other strategy, will not provide 100% accuracy.
Risk management and proper strategy implementation are essential for success in this market.
Read More