In the midst of simple to complex trading strategies, methodologies, and concepts to trading in the Forex market, a few traders search deep to find the right set of tools to simplify trading.
Trading indicators are similar to sailors’ compasses, indicators help traders trade with market direction, making better predictions and in due course make profit.
With market volatility and trend setting on every trader’s mind, adopting the best day trading indicators requires testing in different market situations.
Trading currency pairs, stocks or futures entails testing out with one or a combination of indicators to know which best performs in a given market condition.
Understanding how to apply a method, Pros and Cons of each trading indicator helps one make the best use of each or a combination of a set of indicators.
Below is a crop of one of the best and widely used day trading indicators, describing its features and limitations. Before we examine these indicators, let’s know what day trading indicators are.
What is a Day Trading Indicator?
A day trading indicator is a mathematical tool used to predict the movement in price of an instrument within a day of trading.
Metrics such as historical price, volume, market information or news are used to plot and predict the direction of a financial instrument.
A trading indicator is a fundamental part of technical analysis which entails chart plotting, statistical formulas and methods which enables traders understand, scientifically predict and have a clearer outlook to the market.
Technical indicators are quantitative tools that has been tested, proven and adopted by traders as a measure to analyze instruments before and after trading.
We will discuss these day trading indicators for currencies and stocks much later.
- Bollinger Bands.
- Moving Average Convergence Divergence (MACD).
- Pivot Points.
- Fibonacci Retracements.
- On Balance Volume (OBV)
- Awesome Oscillator.
- Ichimoku Indicator.
- Average True Rate.

How Do I know the Best Technical Indicator for Day trading?
The word “Best” is relative and there are no two indicators that analyses a set of data the same way. Choosing an indicator or set of indicators largely depends on the trader, his knowledge and market situation.
The choice of indicator to use also depends on type of instruments outlined for trading either stocks, commodities, indices or currencies. Technical indicators have “Pros” and “Cons” which suggest careful application of each.
For example, the Pivot Points (PP) technical indicator determines potential support/resistance level and directional movement of an instrument which is calculated with data from previous day of trading.
The PP are very reliable to use because they deal mainly on price volatility and many traders watch the market using the Pivot Points indicator.
As ideal as the PP is, the PP should not be used in isolation, but must be complemented with other indicators for better entries.
Another excellent tool is the On-Balance Volume (OBV), which relates volume of the instrument to its price. As a motion indicator, the OBV helps to check if the market’s volume influences the price of a stock which makes it good in tracking divergence on charts. The downside to the On-Balance Volume is that it does not provide all the data needed to properly analyze price action.
One must analyze and understand a pocket of trading indicators as none is perfect. A combination of a set of indicators is recommend for different trading scenarios and market conditions.
Best Indicators for Day Trading Currencies and Stocks
Bollinger Bands
Bollinger Bands is a very popular trading indicator and it derived its name from John Bollinger in the 1980s.
Bollinger Bands is an oscillator indicator that measures price volatility of a financial instrument.
This indicator deploys the use of a statistical chart indicating simply, market volatility, historic price highs and lows. It also analyses instrument’s overbought or oversold positions. All variables are determined by a methodic formula and are used to plot statistical charts.
On a graphical band and with a decent volatility in charts, the Bollinger Bands display minimum and maximum of moving averages from the lower to middle and upper bands.
How are Bollinger Bands used?
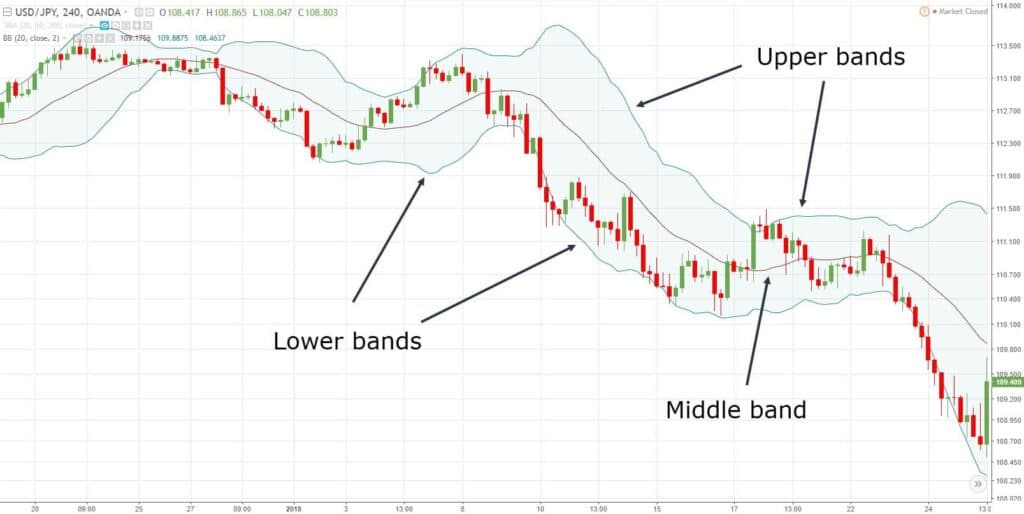
Three bands are prominent in the Bollinger Bands,
- Upper band.
- Middle band.
- Lower band.
During low market volatility, the bands are narrower while in high market volatility, the band expands.
Day traders set the Bollinger Bands with a 20 period Moving average and 2 Standard Deviations. Swing traders usually set at 50 period MA and 3 Standard Deviations.
Upper band represents the overbought space.
Calculated as Period (P) + N Standard Deviations, (common value = 20 + 2 STD).
Middle band represents the base for the higher and lower band. Calculated using simple moving averages (common value = 20).
Lower band represent the oversold space.
Calculated as Period (P) – N Standard Deviations, (common value = 20 – 2 STD).
The Bollinger Bands are further used to analyze pricing of instruments in the short term and predict if the price of a currency, stock or commodity will rise or fall to a certain level.
Overtime, traders have deployed Bollinger Bands on automated systems positioning all trading tools in one place and ultimately aiding better decision making.
See Also: Day Trading Strategies for Beginners
Moving Average Convergence Divergence (MACD)
Moving Average Convergence Divergence (MACD) is a trend-moving indicator that measures two moving averages of an instrument’s price.
The MACD help investors determine the price sensitivity of a currency or stock. MACD checks if the price is strengthening in a bullish market condition or weakening in a bear.
MACD signals when to Buy (crosses above) and Sell when it dips below.
The MACD is calculated by deducting 26 period Exponential Moving Average (EMA) from 12 periods EMA.
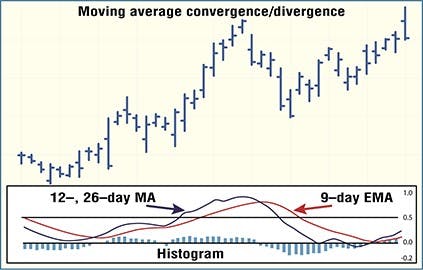
An Exponential Moving Average is type of moving average that places much emphasis on the most current data points.
The outcome of the calculation is the MACD line. Afterwards a 9-day EMA is plotted above the MACD which is often referred to as the “Signal line”, which also prompts the trader to take an action.
A trader may decide to buy when the MACD line crosses above the Signal line.
MACD= 26 Period EMA – 12 Period EMA
Overall, the Moving Average Convergence Divergence triggers a bullish signal when to buy when the MACD line goes above the signal line. The MACD also gives a bearish signal when the line goes below the signal line.

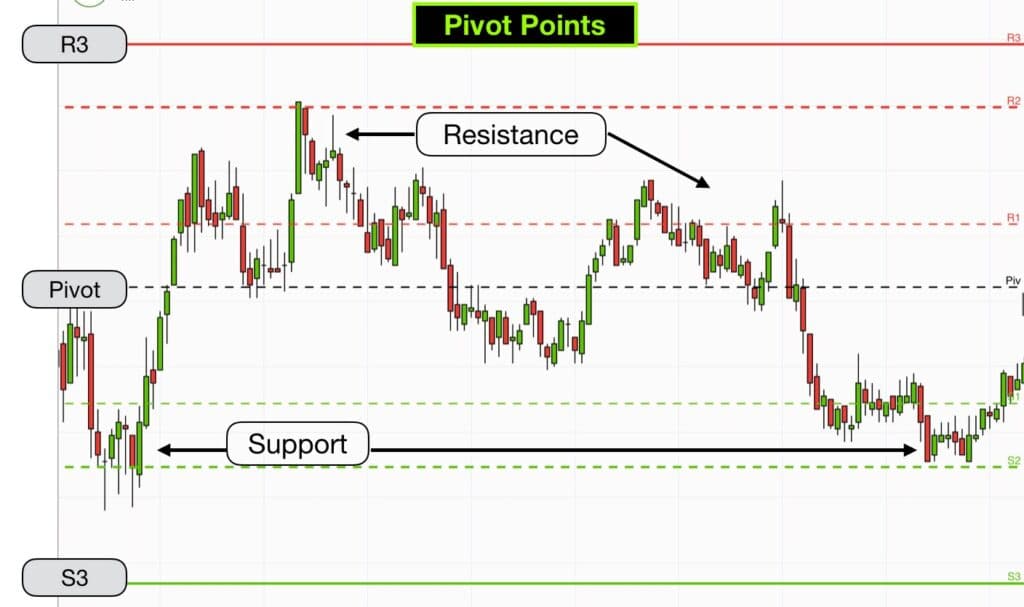
Pivot Points
A Pivot Point represents the price at which the direction of an instrument changes. Pivot Points are directional movement indicators used by traders to determine support and resistance levels.
Pivot Points appear on every chart, the highs, lows and closing prices for the day are used to analyze and used to determine the likelihood of the instrument’s price trend for the next trading day.
Pivot Points are very reliable because they are determined solely by price.
Intraday point also referred to as the Central Pivot Point is the point where there is a balance between the buyers and sellers. The trading volume is usually very high at the intraday point and is often applied as the main trading range of the day.
Traders take action usually at the Pivot Point and the first support or resistance levels. A breakaway from this point often affects the rest of the trading day causing traders to adjust their pricing of the instrument.
Pivot Points are one of the most accurate indicators offering excellent support and resistance level. However, Pivot Points are not to be used in isolation.
Most traders use the Pivot Point to watch the market and make investment decisions.
See Also: Beginners – Forex Lots and Pips Simplified
Fibonacci Retracements
Named from Fibonacci Sequence, Fibonacci Retracements are another technical method of determining support and resistance levels.
The concept of this idea is that it is expected that the market will retract to its original position and repeat the same movement or trajectory.
This method now gives room for traders to speculate on currencies and stocks.
With Fibonacci Retracements, you can do the following:
- Plot support lines.
- Determine resistance levels.
- Set entry and exit target prices.
- Place stop loss orders.
Fibonacci Retracements are determined by picking two extreme points on the chart and divide the vertical distance by the key Fibonacci Ratios.
These key Fibonacci ratios are: 23.6%, 38.2%, 50%, 61.8%, and 100%. These numbers are standard and where determined from the Fibonacci number series (0, 1, 1, 2, 3, 5, 8, 13, 21, 34, 55, 89, 144). The sum of two preceding terms are used to determine the sequence.
After calculating the ratios, horizontal lines are drawn to determine support and resistance levels and each line represents any of the ratios above. The horizontal lines are the Fibonacci retracement levels.
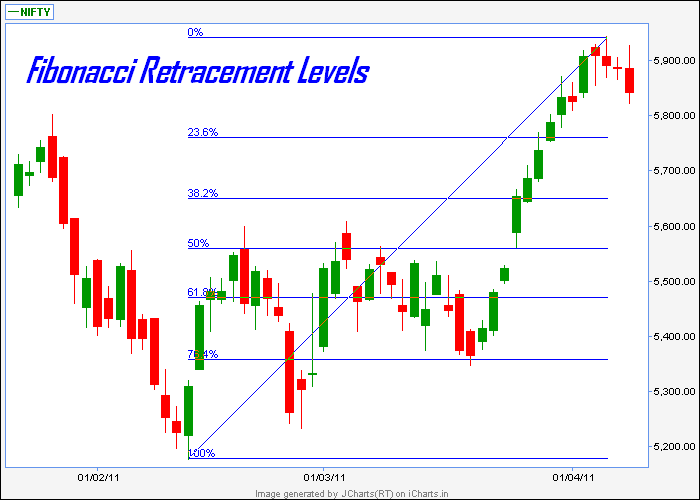
Overall, Fibonacci retracements helps traders strategically target prices, set stop loss and predict more accurately support and resistance levels. The downside is that not all traders easily understand it, it takes experience and skill to get it correctly.
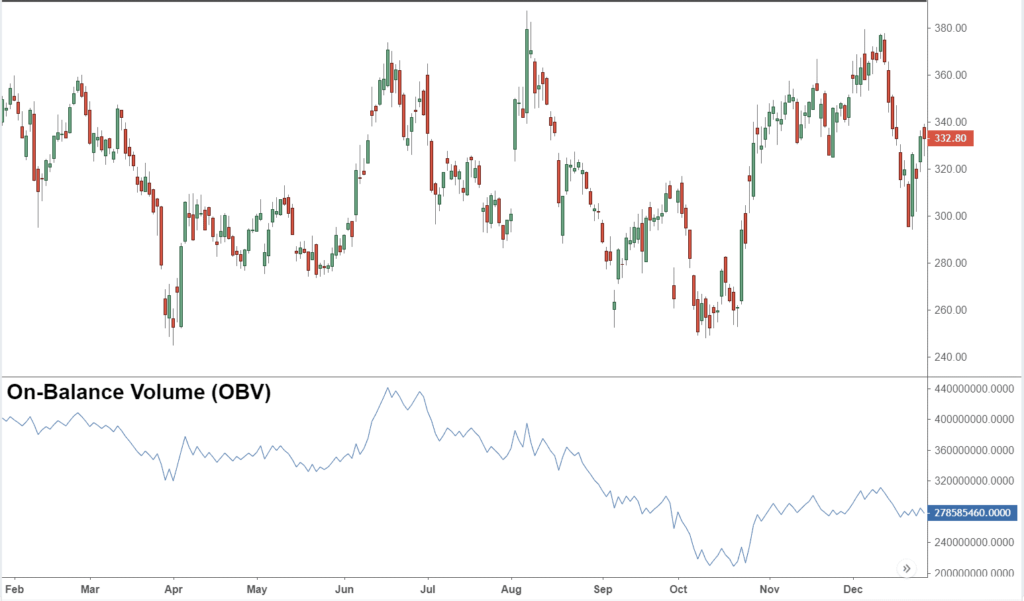
On Balance Volume (OBV)
The On Balance Volume (OBV) was developed by Joe Granville. This indicator uses volume flow to predict the changes in price of an instrument. The OBV relates volume to price and helps traders determine when a major market move will happen using huge volume as a basis for assumption.
On Balance Volume (OBV) indicator shows if the market’s volume is channeled towards an instrument.
- When the price of the instrument closes above the previous day’s price, it is regarded as an Up-volume.
- When the price of the instrument closes below the previous day’s price, it is regarded as a Down-volume.
The OBV is a brilliant indicator that helps determine major market moves and also excellent in a trending market.
The downside is that the OBV falls short of the required data for proper technical analysis and thereby could lead to some inconsistencies. The OBV is best used in a combination with other technical indicators.
Awesome Oscillator
The Awesome Oscillator is a momentum indicator that checks the strength or weakness of a stock in terms of pricing. In a nutshell, the Awesome Oscillator (AO) indicates if the market is bullish or bearish.
Awesome Oscillator compares the momentum of the market for a recent number of periods to a larger number of periods. Simply put, AO calculates the difference between the 5 Simple Moving Averages (SMAs) and the 34 SMAs.
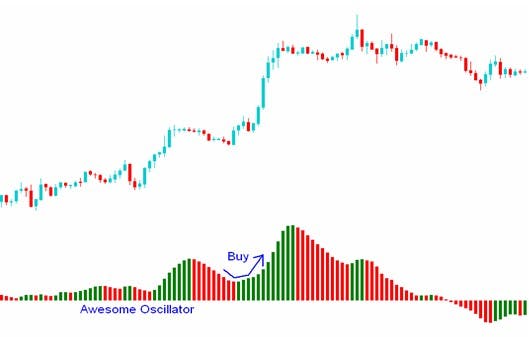
The SMA used are the midpoints to calculate not the closing price of the instrument.
How to use the Awesome Oscillator
- Open a Buy position when the oscillator is above point zero signifying a gap.
- Open a Sell position when the oscillator goes below point zero signifying a peak.
- Buy at two lows below the zero line where the second low is not as low as the previous.
- Sell at two peaks above the zero line where the second high is lower than the previous one.
Awesome Oscillator indicator checks market trend for possible reversals. The AO should be used in combination with other technical indicators for proper analysis.

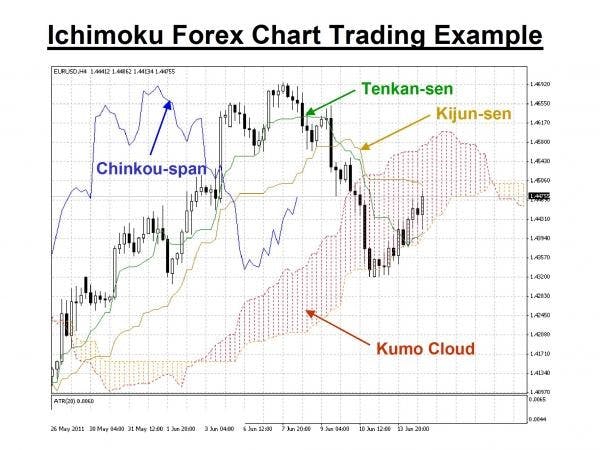
Ichimoku Indicator
The Ichimoku Indicator is similar to Moving Averages. It is a system that follows the trends and not only measures the direction of the market but predicts price movements.
Ichimoku is great at revealing support and resistance level on charts. This indicator performs well on current market trends, it however could give off inaccurate signals on non-trending markets
See Also: How to Choose a Forex Broker
Average True Rate
Average True Rate (ATR) indicator tests the prevalent pricing volatility of a given security. The ATR analysis trading ranges over a period, taking into account fluctuations in the market.
The concept of ATR measures the range between the highs and the lows of a security.
I.e. Range = Price High – Price Low
To get ATR, one must calculate the True Rate (TR) which improves the accuracy of this indicator. The TR is the whole value of the largest measure of
- Previous low to current high.
- Current period high to low.
- Previous low to current low.
After calculating the True Range, then the ATR can be determined by finding the average of the TR.
Average True Rate simply tests for market volatility while overlooking market direction. For simplicity and ease of trading, the ATR indicator mechanism is available on many forex trading platforms, for automated entries.
Final Thoughts
Technical indicators are the trader’s compass, navigating through the forex charts.
With different methodologies and trading strategies, experts have developed these amazing and tested indicators to help 21st century traders navigate the market and make the best out of it.
Kindly note that many of the indicators mentioned have their strengths and weaknesses and as such must be tested on a demo or smaller account to understand it effectiveness.
Also note that the deficiencies of some of the indicators suggests that they should be paired with other indicators for a robust trading experience.
We wish you a happy trading!
Image credit: Icon vector created by macrovector – www.freepik.com


Read More