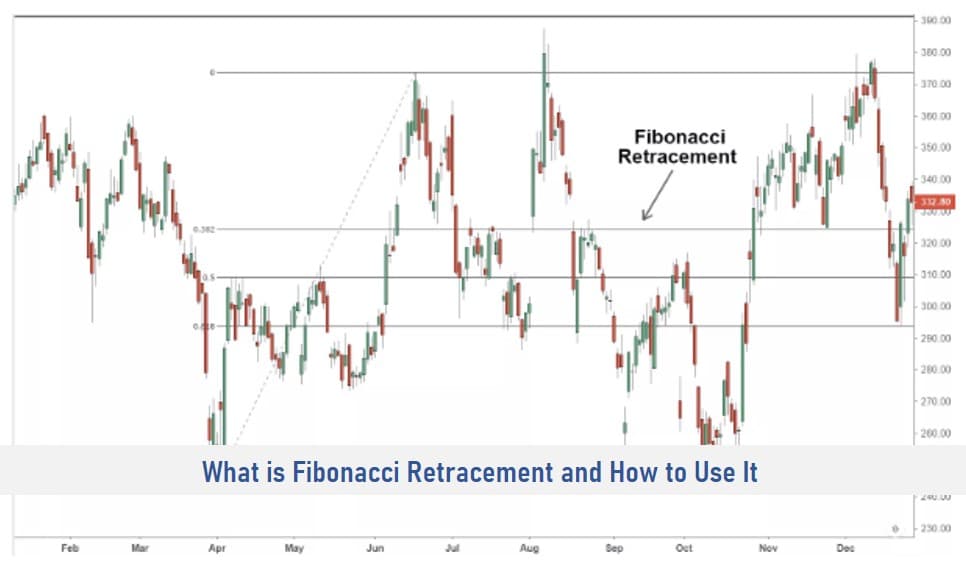
What is Fibonacci Retracement?
Fibonacci is a well-known tool among Forex traders, especially among traders who prefer technical analysis to trade the Forex market.
Fibonacci retracement is based on the work of an Italian mathematician, Leonardo Fibonacci who came up with the sequence that proves that everything in the universe repeats itself in a specific mathematical order.
In applying these sequences to the Forex market successful traders have proven that it is possible to determine points of entry, take profit as well as stop-losses in trending markets. How does this happen?
It is a known fact that price does not necessarily move in a straight line. This means if for example in an upward trending market where bulls have higher power, a point is reached where they get exhausted and the bears come in to create a retracement back to a previous level before the uptrend continues and vice-versa in the case of a downtrend. How do you get the levels to enter trades and exit?
SEE ALSO: 5 Best Types of Technical Indicators For Scalping
SEE ALSO: A Beginner’s Guide – How To Analyze 3 Types of Forex Charts
To be able to find Fibonacci retracement levels, you have to find recent obvious swing low and swing low points on the chart.
The levels are plotted from the swing low to the swing high.
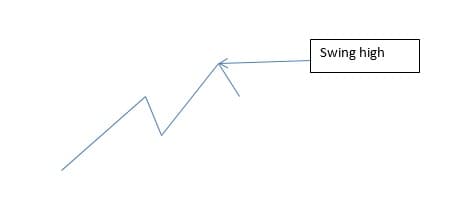
Swing highs are peaks reached before a decline. A swing high is formed when a high is reached which is greater than the other previous highs after which the price falls lower.
Below is an example of a swing high
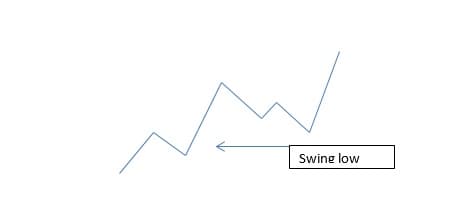
A swing low is the opposite of a swing high. Price swings continually into low points before moving back higher. Below is an example of a swing low in an uptrend.
Using Fibonacci retracement in an uptrend
The most significant steps are finding the swing low point and the swing high points. The Fibonacci retracement levels are plotted using the swing low as the start point. Click on the swing low and drag the cursor to the most recent swing high.
Using Fibonacci retracement in a downtrend
Click on the swing high and drag the cursor to the most recent swing low.
The retracement levels are 0, 23.6%, 38.2%, 50%, 61.8% and 100%. It must be stated that although there also sometimes reactions around the 78.9% and 88.9% zones too, they are not widely recognized levels.
Points to note when using The Fibonacci Levels
- Prices won’t always bounce from these levels.
- It is best to draw your Fibonacci levels on higher timeframes to have better accuracy of results.
- Fibonacci retracement is best used in confluence with other tools to guarantee better results.
Final Thoughts
Fibonacci Retracements is a technical analysis tool used to determine stop-loss, stop-orders, place entry orders and set target prices. They are static prices that do not change just like the moving averages.
These characteristics allow for easy identification whenever you see them. So, traders are quick to react and adjust when price levels are put to test as prices remain static.


Read More