
With a multitude of trading strategies and ways to analyze the market, most traders are skeptical about the right path to follow.
We’ll discuss the basics of technical analysis in forex trading and why it is critical to the success of your trading career.
In this article, we’ll also compare technical analysis with fundamental analysis and see why these method of analysis should be approached differently.
What is Technical Analysis in Forex Trading?
Technical analysis is simply studying historical patterns in currency pairs or market trends to help predict the direction or performance of the market.
In technical analysis, forex charts are trading tools used to look for similar patterns that have occurred previously in the market. As we know, history repeats itself. Analyzing charts have become a reliable way for traders to use in making an informed decision.
There are different types of charts a trader can use for forex technical analysis, we shall discuss this much later. A trader’s approach to reading charts also depends if the trader is a swing or day trader and as such, the chart reading approach is not the same.
A day trader for example will prefer to analyze shorter time frame charts (one-minute, fifteen-minutes, hourly, daily charts).
Contrary to the method of analyzing data for a day trader, a swing trader prefers to analyze, weekly, biweekly, months, quarterly charts in such circumstances.
These charts are readily accessible on your MetaTrader platform 4 or 5, on a demo and live account.
Credit – Tradingwithbrayn
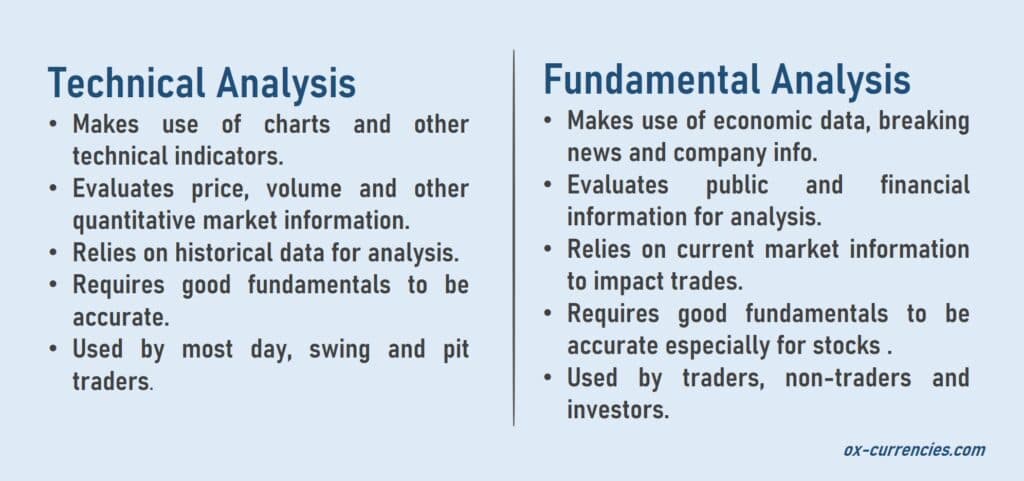
Technical vs. Fundamental Analysis, Which is Better?
We’ve established that technical analysis involves looking at historical data of currency pairs for possible prediction of the market direction.
Fundamental analysis involves analyzing economic data and events that could impact the performance of the forex market. Economic data and events such as GDP figures, Fed rate/monetary policy rate adjustment, the release of employment figures, oil price, performance in the stock, commodities, and fixed income markets influence the overall financial ecosystem.
So, a trader must consider external influences to his trade and incorporate them into his trading strategy.
Some experts have argued the superiority of technical and fundamental analysis .
Let’s compare these two distinct types of analysis.
Principles of Technical Analysis in Forex Trading
The principles of technical analysis depict that some trading philosophies that have formed the basis for present and future methodologies in forex trading.
These are some of the principles:
- In forex chart analysis, history repeats itself.
- Market makers set prices for currency pairs.
- Price action still dictates the majority of the activities in the market.
- Technical and fundamental analysis are mutually inclusive.
How Does Technical Analysis Work?
As mentioned earlier, technical analysis involves backtesting, which is simply analyzing historical data that helps form a basis for future prediction of market performance.
The way technical analysis works is that forex charts are tools used to analyze the 3 types of currency pairs which are, the Majors, Minors, and Exotic currency pairs.
SEE ALSO: 7 Best Currency Pairs to Trade as a Beginner
A trader then decides which pair to analyze at a time and develops his trading strategy.
Usually, there are two approaches to technical analysis, the top-down approach, and the bottom-up approach.
Top-down approach
This involves first analyzing the economy and financial market from a broader spectrum and narrowing it down to the forex market, trading sessions, and then currency pairs.
Short-term traders usually adopt this method of technically analyzing data since they look to take profits quickly and repetitively. Traders try to spot likely external influences that could trigger a price action and consider it in their strategy. This prevents reactionary trading but pre-empts the trader for possible market swings.
For example, a trader may decide to look at a weekly EUR/AUD chart to check for volatile periods. He does this by analyzing the time frames with upticks in the market. He charts those periods and marks the possible entry and exit points.
His strategy may be to decide suitable support and resistant points for the EUR/AUD and predict when such volatility will likely occur in a daily chart.

Bottom-up approach
This approach involves focusing on specific currency pairs that possess some good fundamentals irrespective of what the forex market and other financial markets are doing.
The Bottom-up approach to technical analysis usually favors major pairs which have good fundamentals and consistent historical pattern.
This class of currency pairs is a lot easier to analyze since they have verifiable and reliable history. Entry and exit points are a lot more predictable.
For instance, the EUR/USD is one of the most traded currency pairs in the world owing to its predictability, liquidity, and tight spread.
Having considered these two major approaches to technical analysis, traders may include some other methods suitable to them.
A day trader might prefer using trend lines to analyze while Swing traders may stick to a candlestick chart. However, their technical additions are all hinged on the premise of these two approaches to analysis.
Types of Forex Charts Used in Technical Analysis
Reading and understanding Forex charts is a beginner reader’s nightmare, the leap, and plunge of trading indicators, tickers on live chats are somewhat intimidating for a first-time trader.
It’s important to know that reading the forex chart is a form of technical analysis.
I will explain 3 types of forex charts available for technical analysis.
Forex Line Charts
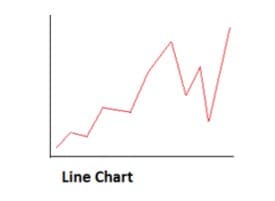
This type of forex chart seems to be the most comfortable especially for beginners. In forex line charts, visible lines are used to show the closing prices of a currency pair and the direction of the market for a period.
Most line charts can read forex historical trades for up to 5 years; however, a typical forex line chart can display hourly, daily, weekly, monthly, quarterly and annual trends for series of currency pairs.
For proper technical analysis and understanding of a currency pair, one needs to read and understand a more detailed forex chart.
Forex Bar Charts
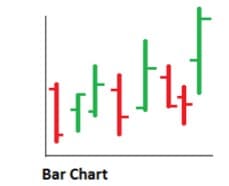
Beyond the closing price and studying the direction of the forex market, the forex bar charts gives better insight into the currency highs and lows during trading hours.
This means that one can determine the highest attained price of a currency pair and the lowest within a time frame. This helps a trader to predict the possible highs and lows of a currency pair and determine his entry and exit strategy.
Bar charts also feature a vertical bar that indicates the trading range while the horizontal hash on the left and the right displays the opening and closing prices respectively.
Forex bar charts aid better technical analysis especially in setting a stop-loss.
Reading forex charts is required for successful trading, it is your compass and road map to profitable trading. When you understand the forex line chart. Start developing your chart reading skills with the bar chart.
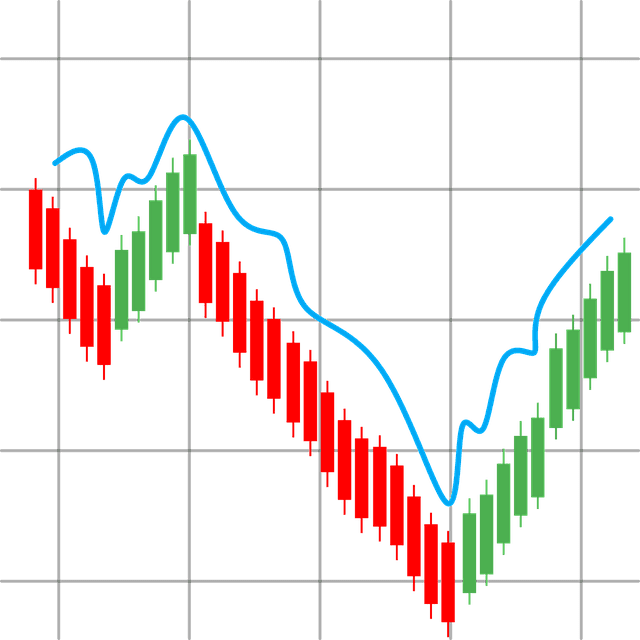
Forex Candle Sticks
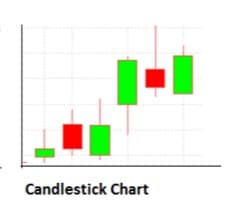
On more advanced trading platforms, one tends to find the forex candlesticks prominent on the screen. The forex candlesticks have become an expert trader’s favorite.

The candlesticks are a cleaner version of the bar charts, they have a better interface and colored graphics. If you understand the bar charts, then candlesticks should not pose a problem. The forex candlesticks indicate open and close prices, highs and lows as well.
The height of the candlestick indicates the trading range for the period while the body shows the distance between the opening and closing price of a single currency pair.
When a currency pair opens and closes at different price values, the colors of the bars change. For example, most trading software display a “high” in green and a low on “red”.
Reading forex bar charts should not pose a serious challenge once you master the line, bar, and candlestick charts.
Choosing the Right Approach to Technical Analysis
Deciding on a Strategy
Decide if you’re scalping the charts or hanging in there long-term. Your profit taking approach will determine the strategy you’ll adopt. Scalping entails making quick entries and exits within a one-five minutes chart. This may seem profitable as small pips cumulate to big gains at the end of the session if done well. Mind you that a wrong trade could as well wipe out previously accumulated profits.
Choose a Set of Currency Pairs
Not all currency pairs are the same. The majors, minors, and cross pair behave differently and some are easier to predict than the other.
Some are not recommended for beginners, some are more profitable than others. So, you need to understand the characteristics of currency pairs in the forex market and limit yourself to a few you’re comfortable with.
SEE ALSO: 7 Best Currency Pairs to Trade as a Beginner
Choose the Right ECN Forex Broker
Many newbie traders overlook this part and think that all forex brokers are the same.
First of all, we do highly recommend you start with an ECN forex broker. ECN means Electronic Communication Network. This means that the trader’s orders are executed in real-time without having to go through a broker’s dealing desk or traditional exchanges.
So, you need to clarify with your broker to be sure orders are executed electronically, speedily, and without third-party interference. Take note of charges as well, and be sure they don’t rip you off with unscrupulous profit and withdrawal charges as well.
SEE ALSO: Reliable ECN Forex Brokers
Introduce Additional Software/Tools
As traders fine-tune strategies to boost trading performance, experts and software developers have devised and introduced software or forex robots that can help improve the traders’ overall profit, not only that, the introduction of forex robots have helped with complex chart analysis and backtesting of historical data. Some traders are however skeptical about the use of forex software to trades.
The fact is that over 81% of traders that have used software trading tools to trade have reported tremendous improvement in the outcome of their trades. Not only has that increased profitability for traders, but the mentally tasking work of daily analyzing charts have also greatly reduced.
Experts however cautioned users of forex robots to use these tools responsibly as forex robots are not foolproof and can sometimes predict wrongly especially with currency pairs that have unreliable fundamentals.
See some of our forex robots that have recorded brilliant pip performance. Forex backtesting analysis and chart reading are all done for you with this software that also supports auto trading as well.
A special addition to forex software these days offers a Broker Spy Module which helps calculate broker’s commission up front without you having to do that manually.
Trading is now a lot easier with the introduction of advanced trading tools.
Top 5 Forex Robots that Work.
[table id=4 /]
Final Thoughts
Technical analysis forms the bedrock of forex trading.
With different methods of analyzing historical data, it’s still up to the trader to correctly interpret what he reads.
In technical and fundamental analysis, the trader still takes the final decision on what and when a currency pair is to be traded. Technical and fundamental forex analysis are required for successful currency trading.
Image Credit: Design vector created by freepik – www.freepik.com

Read More