Fibonacci retracement is a popular tool that traders use to identify potential support and resistance levels on a price chart. It is based on the idea that prices tend to retrace a predictable portion of a move, after which they continue in the original direction. This concept is based on the Fibonacci sequence, a series of numbers in which each number is the sum of the two preceding numbers.
Understanding Fibonacci Retracement and Its Origins Fibonacci retracement is named after the Italian mathematician Leonardo Fibonacci, who introduced the Fibonacci sequence to the Western world in the 13th century. The sequence is found in many natural phenomena, such as the growth patterns of plants and the arrangement of leaves on a stem. The sequence is also found in financial markets, where traders use it to identify potential levels of support and resistance.
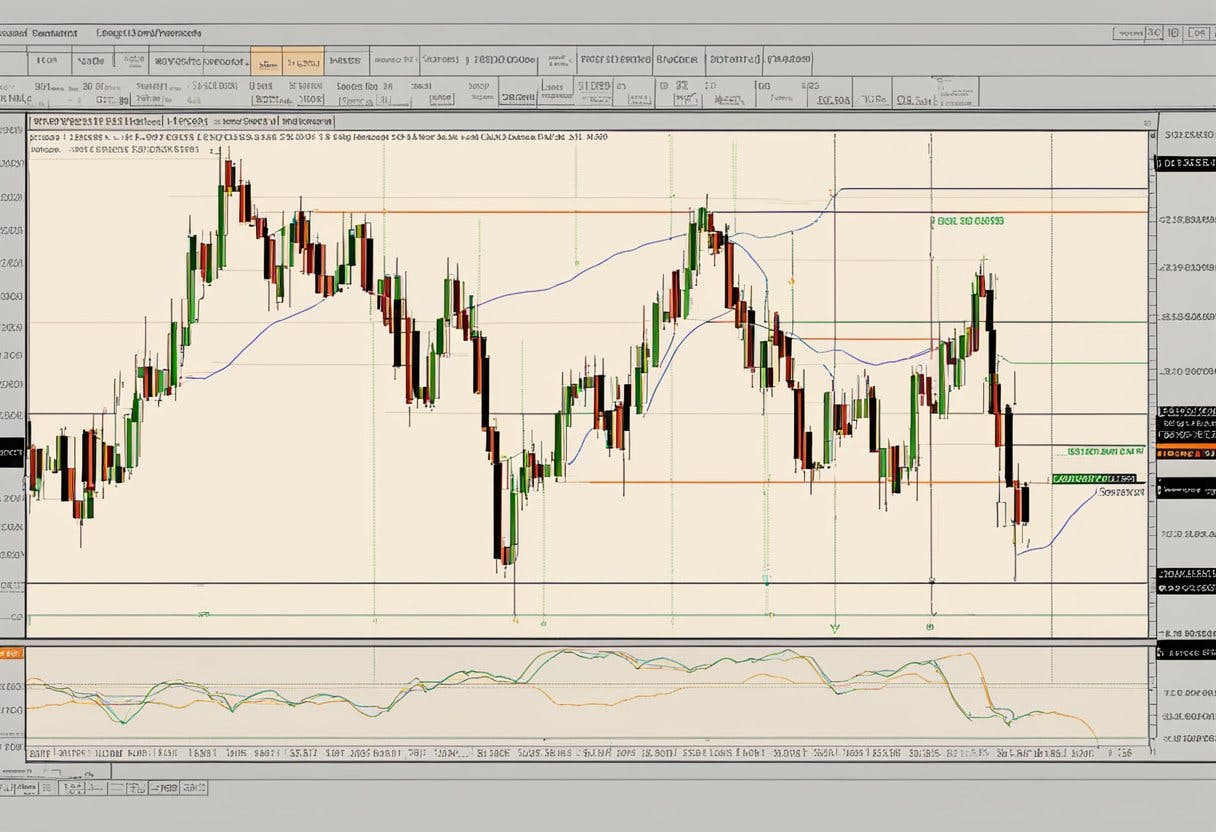
The Basics of Fibonacci Retracement in Forex In Forex trading, Fibonacci retracement is used to identify potential levels of support and resistance on a price chart. Traders plot the retracement levels by identifying the high and low points of a trend and drawing horizontal lines at the key Fibonacci levels. These levels are 23.6%, 38.2%, 50%, 61.8%, and 100%. The 50% level is not a Fibonacci level but is included because it is a common reversal point in the market.
Key Takeaways
- Fibonacci retracement is a popular tool used by traders to identify potential support and resistance levels on a price chart.
- It is based on the Fibonacci sequence, which is found in many natural phenomena and financial markets.
- Traders use Fibonacci retracement in Forex trading to identify potential levels of support and resistance on a price chart.
Understanding Fibonacci Retracement and Its Origins
Fibonacci retracement is a popular technical analysis tool used by traders to identify potential levels of support and resistance in financial markets. It is based on the Fibonacci sequence, a mathematical concept discovered by Leonardo Fibonacci, an Italian mathematician, in the 13th century.
The Fibonacci Sequence and the Golden Ratio
The Fibonacci sequence is a series of numbers in which each number is the sum of the two preceding numbers, starting from 0 and 1. The sequence goes as follows: 0, 1, 1, 2, 3, 5, 8, 13, 21, 34, 55, 89, 144, and so on. The ratio of any two adjacent numbers in the sequence approaches the golden ratio, which is approximately 1.618.
The golden ratio is a mathematical concept that appears in nature and has been used in art and architecture for centuries. It is believed to represent a sense of balance and harmony. Traders use the golden ratio to identify potential levels of support and resistance in financial markets.
Historical Significance of Fibonacci in Financial Markets
Leonardo Fibonacci introduced the Hindu-Arabic numeral system to Europe through his book “Liber Abaci” in 1202. This system replaced the Roman numeral system, which was inefficient for performing calculations. The book also introduced the Fibonacci sequence, which was used to solve a problem related to rabbit breeding.
The Fibonacci sequence and the golden ratio gained popularity in financial markets in the 20th century, thanks to the work of Ralph Nelson Elliott, who used the concept of waves to analyze market movements. Elliott believed that market movements could be broken down into a series of waves, with each wave being a smaller version of the larger wave. He used the Fibonacci sequence and the golden ratio to identify potential levels of support and resistance in financial markets.
In conclusion, Fibonacci retracement is a popular technical analysis tool used by traders to identify potential levels of support and resistance in financial markets. It is based on the Fibonacci sequence and the golden ratio, which have historical significance in financial markets. Traders use these concepts to identify potential levels of support and resistance in financial markets.
The Basics of Fibonacci Retracement in Forex
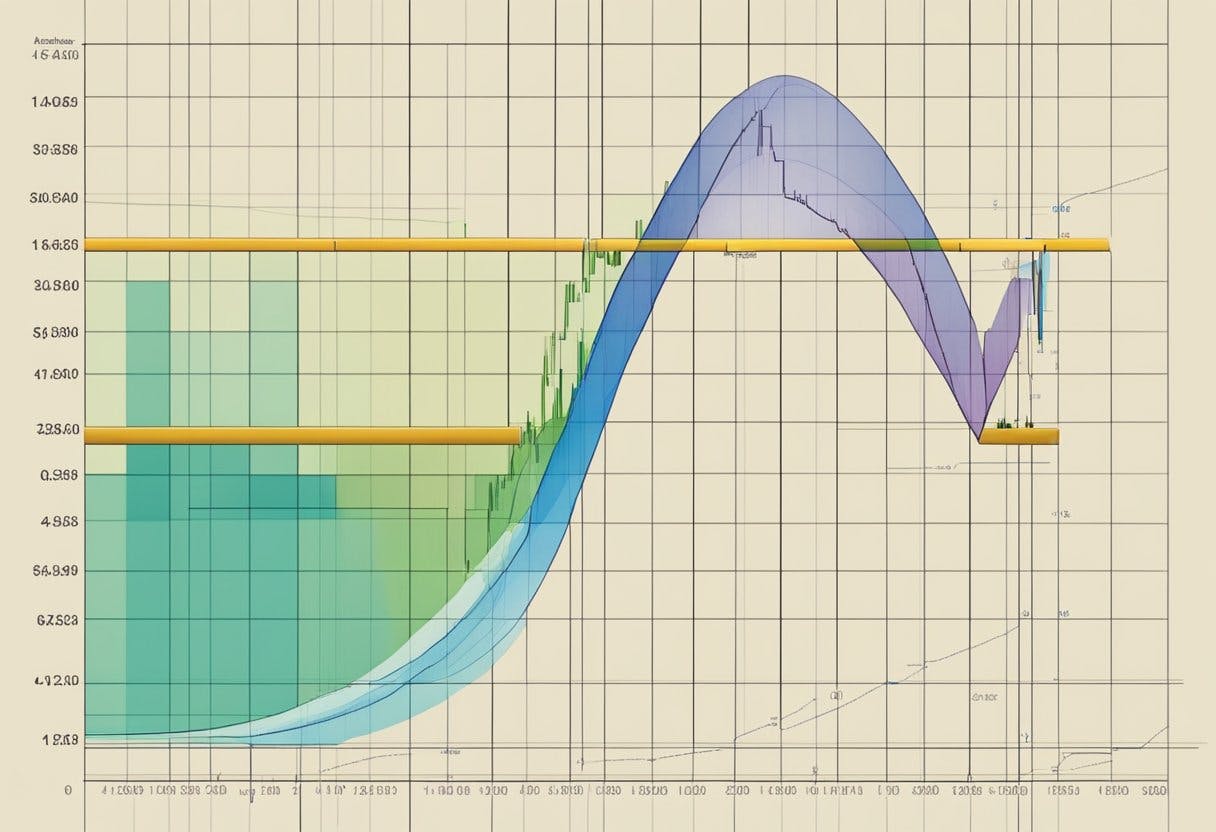
Fibonacci retracement is a popular technical analysis tool that is used to identify potential support and resistance levels in the forex market. This tool is based on the idea that after a significant price movement in one direction, the price will often retrace a predictable portion of that move before continuing in the original direction. This predictable portion is known as a retracement level and is derived from the Fibonacci sequence of numbers.
Defining Retracement Levels
A Fibonacci retracement tool is used to draw a series of horizontal lines on a forex chart that correspond to the Fibonacci retracement levels. These levels are calculated by identifying the high and low points of a price move and then dividing the vertical distance between these points by the key Fibonacci ratios of 23.6%, 38.2%, 50%, 61.8%, and 100%.
Traders use these levels to identify potential areas of support and resistance. The 23.6% and 38.2% levels are considered shallow retracements, while the 50% level is considered a moderate retracement. The 61.8% level is considered a deep retracement, and the 100% level represents a complete retracement of the original price move.
Identifying Uptrends and Downtrends
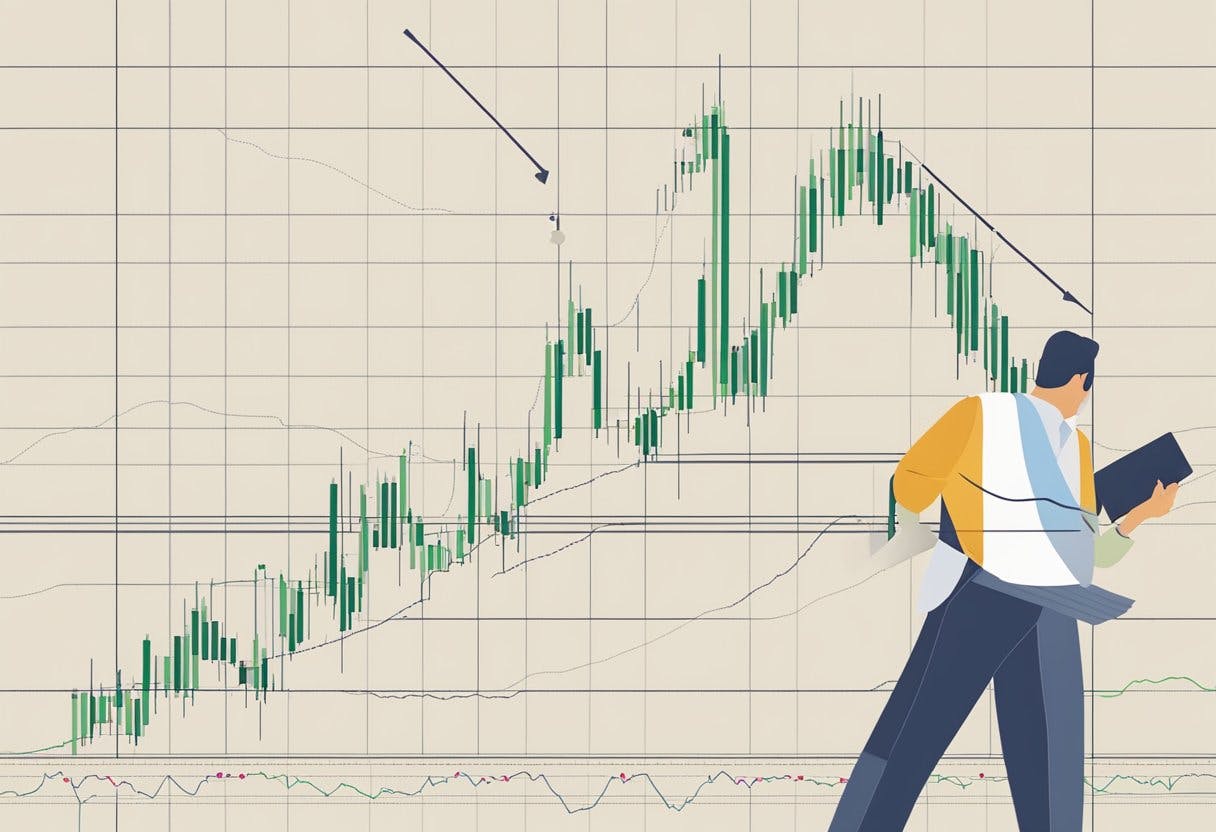
Fibonacci retracement levels are most commonly used in conjunction with trend analysis. In an uptrend, traders look for potential buying opportunities at retracement levels, while in a downtrend, traders look for potential selling opportunities at retracement levels.
To identify an uptrend, traders look for a series of higher highs and higher lows on a forex chart. Once an uptrend has been identified, traders can use Fibonacci retracement levels to identify potential areas of support where they can enter long positions.
To identify a downtrend, traders look for a series of lower highs and lower lows on a forex chart. Once a downtrend has been identified, traders can use Fibonacci retracement levels to identify potential areas of resistance where they can enter short positions.
In conclusion, Fibonacci retracement levels are a useful tool for identifying potential support and resistance levels in the forex market. Traders can use these levels to identify potential buying and selling opportunities and to manage their risk by placing stop-loss orders at key retracement levels.
Applying Fibonacci Retracement to Trading Strategy
Fibonacci retracement levels can be used to identify potential support and resistance levels in trading. Incorporating Fibonacci retracement with other indicators can help traders to identify potential trade setups.
Incorporating Fibonacci Retracement with Other Indicators
Traders can use Fibonacci retracement levels in conjunction with other indicators such as moving averages, candlestick patterns, and other technical analysis tools. By combining these indicators, traders can get a better idea of the overall market sentiment and identify potential trade setups.
For example, if a trader sees that the price level is approaching a Fibonacci retracement level and a moving average is providing support at the same level, it may be a good time to enter a long position. Similarly, if a trader sees that the price level is approaching a Fibonacci retracement level and a bearish candlestick pattern is forming, it may be a good time to enter a short position.
Setting Up Trades Using Fibonacci Levels
Traders can use Fibonacci retracement levels to set up trades by placing orders at key levels. For example, a trader may place a buy order at the 38.2% Fibonacci retracement level with a stop loss below the 50% level. This allows the trader to enter the trade at a potentially favorable price level while minimizing their risk.
Traders can also use Fibonacci retracement levels to take profits by placing sell orders at key levels. For example, a trader may place a sell order at the 61.8% Fibonacci retracement level with a take profit order at the 100% level. This allows the trader to exit the trade at a potentially favorable price level while locking in profits.
Overall, incorporating Fibonacci retracement levels into a trading strategy can help traders to identify potential trade setups and manage risk. By combining Fibonacci retracement with other indicators and setting up trades using key levels, traders can improve their chances of success in the forex market.
Advanced Fibonacci Trading Concepts
Fibonacci retracement levels are a powerful tool in forex trading, but they are just the beginning of what traders can do with Fibonacci analysis. In this section, we’ll explore some advanced concepts that can take your Fibonacci trading to the next level.
Fibonacci Extensions and Confluence
Fibonacci extensions are similar to retracements, but they project future price levels beyond the current trend. These levels can be used to identify potential profit targets or areas of resistance. When Fibonacci extensions line up with other technical indicators, such as trend lines or oscillators, it creates a confluence of signals that can increase the probability of a successful trade.
Elliott Wave Theory and Fibonacci
Elliott Wave theory is a popular technical analysis tool that uses wave patterns to predict market movements. Fibonacci ratios are often used to identify the end of waves and the beginning of new ones. By combining Elliott Wave theory with Fibonacci analysis, traders can gain a deeper understanding of market trends and potential reversal points.
In conclusion, advanced Fibonacci trading concepts can be a valuable addition to any forex trader’s toolbox. By using Fibonacci extensions, confluence of signals, Elliott Wave theory, and other technical indicators, traders can gain a deeper understanding of market trends and improve their chances of success.
Practical Tips and Considerations for Forex Traders
When using Fibonacci retracements in forex trading, there are a few practical tips and considerations that traders should keep in mind to maximize their success and minimize their risk.
Risk Management and Fibonacci
One of the most important considerations when using Fibonacci retracements is risk management. As with any leveraged product, there is a risk of losing more than your initial investment. Therefore, traders should always use stop-loss orders to limit their potential losses. They should also avoid risking more than they can afford to lose, and seek independent financial advice if necessary.
When using Fibonacci retracements, traders should also consider the risk-to-reward ratio of their trades. For example, if a trader is using a 50% retracement level as a stop-loss order, they should aim for at least a 1:2 risk-to-reward ratio to ensure that they are profitable over the long term.
Analyzing Different Timeframes and Currency Pairs
Another important consideration when using Fibonacci retracements is analyzing different timeframes and currency pairs. Traders should use trendlines to identify the overall trend of the market, and then use Fibonacci retracements to identify potential entry and exit points.
Traders should also consider the volatility and liquidity of different currency pairs, as well as the timeframes they are trading on. For example, short-term traders may prefer to use Fibonacci retracements on lower timeframes, while long-term traders may prefer to use them on higher timeframes.
In conclusion, traders should always exercise caution and use proper risk management techniques when using Fibonacci retracements in forex trading. They should also analyze different timeframes and currency pairs to identify potential entry and exit points. By following these practical tips and considerations, traders can increase their chances of success in the forex market.
Frequently Asked Questions
What is the significance of the golden ratio in Fibonacci retracement levels?
The golden ratio, also known as phi, is a mathematical concept that is often used in technical analysis. In Fibonacci retracement levels, the golden ratio is used to determine potential support and resistance levels. The most commonly used levels are 38.2%, 50%, and 61.8%, which are derived from the Fibonacci sequence. These levels are believed to be significant because they represent areas where price may potentially reverse.
How do I properly apply the Fibonacci retracement tool in a downtrend?
To apply the Fibonacci retracement tool in a downtrend, a trader should first identify the recent significant Swing Highs and Swing Lows. Then, the trader should click on the Swing High and drag the cursor to the most recent Swing Low. The retracement levels will then be automatically drawn on the chart. The trader should look for potential areas of support or resistance at the 38.2%, 50%, and 61.8% levels.
What are the optimal settings for the Fibonacci retracement indicator?
There are no optimal settings for the Fibonacci retracement tool, as it is a subjective tool that is based on the trader’s preferences. Some traders may prefer to use longer-term Swing Highs and Lows, while others may prefer to use shorter-term levels. It is important to note that the Fibonacci retracement tool should not be used in isolation, and should be used in conjunction with other technical analysis tools.
Can you explain a Fibonacci trading strategy that incorporates retracement levels?
One Fibonacci trading strategy that incorporates retracement levels is the Fibonacci breakout strategy. This strategy involves waiting for a breakout above or below a key retracement level, such as the 61.8% level. Once the breakout occurs, the trader can enter a long or short position, depending on the direction of the breakout. Stop-loss orders can be placed below the breakout level to limit potential losses.
How accurate are Fibonacci retracement predictions in the forex market?
Fibonacci retracement levels are not always accurate, as they are based on historical price movements and do not take into account other market factors. Traders should use Fibonacci retracement levels in conjunction with other technical analysis tools, such as trend lines and moving averages, to confirm potential support and resistance levels.
What time frame is generally considered best when using Fibonacci retracements for forex trading?
The time frame that is considered best when using Fibonacci retracements for forex trading depends on the trader’s trading style and preferences. Short-term traders may prefer to use shorter time frames, such as 15-minute or 30-minute charts, while longer-term traders may prefer to use daily or weekly charts. It is important to note that the Fibonacci retracement tool should be used in conjunction with other technical analysis tools, and should not be used in isolation.


Read More