
What are Volatility Indicators?
As far as Forex trading is concerned, the term volatility refers to an extreme price change in a currency pair or any other financial assets.
Volatility also reveals how fast and to what extent prices change in a currency pair or the entire financial market.
Profit in forex trading is derived from either direction of the chart and the movement in prices.
Volatility in forex is different from some options trading where the direction of the asset and the range of motion do not necessarily turn into profit.
In Forex, volatility is what creates trading opportunities. A volatile asset has a range of movement that is wide enough to allow for pip movements.
Without volatility, the trader is left in a state of inactivity. The more volatile an asset is, the greater the potential it is to make money. However, the risks of a highly volatile market expose the trader’s capital to gains or losses.
The challenge for most traders is how to detect and measure the volatility in a currency pair to see if the conditions will support a trader’s position for profit.
For instance, if a trader’s goal is to make 50 pips in a trade, what is the guarantee that the currency pair will witness enough volatility to support his/her expectations?
To get a glimpse of the market before trading, volatility indicators are required in technically analyzing the market.
Indicators will help the trader navigate the market with a clearer view and in-depth knowledge.
Volatility involves the following factors:
- Speed of price change.
- Extent /degree of price change.
- Frequency of price change.
SEE ALSO: CFD Trading – How to Make the Best Use of It
SEE ALSO: How to Reduce Your Risk Exposure by Hedging a Currency Pair
SEE ALSO: Breakout in Forex Trading Simplified
What are the Best Volatility Indicators to Use?
Volatility indicators are trading indicators that signal the frequency and degree of change in the price of a currency pair, stock, commodity, or other financial assets.
With this concept in mind, we can identify four different types of volatility and the volatility indicators relative to each class.
Price Volatility
Price volatility relates to fluctuations in the price of a single currency pair or asset which is measured in percentage on a day-to-day basis. The spread between prices is what defines the volatility of the asset.
The volatility indicators that tend to measure price volatility are the Average True Range (ATR) indicator, Parabolic SAR, Momentum indicator.
Market Volatility
Market volatility is the measurement of the volatility of an entire index. For instance, the Volatility Index (VI) measures the volatility of the S&P 500 index.
The S&P 500 is an index that measures the performance of the top 500 stocks in the US markets. It does this by averaging out the individual volatility of the listed stocks into a single measurable entity.
Mean Period Volatility
This type of volatility measures the degree and speed of price changes of an asset over time. In this case, greater volatility is seen over shorter periods.
This class of volatility indicators is where the moving averages and other indicators based on the moving average are found.
Probability Volatility
This volatility measure focuses on the inherent potential of the price of an asset to attain a certain degree of volatility.
In probability volatility, you can find indicators such as the Bollinger Bands and the standard deviation indicator.
SEE ALSO: 8 Best EA Forex Robots
SEE ALSO: 5 Best Scalping Forex Robots for MT4
SEE ALSO: Advantages and Disadvantages of Using Forex Robots
Other Technical Indicators
There are some common misconceptions about some of the volatility indicators. Traders tend to misconstrue them as directional indicators (the ATR and Bollinger bands).
The volatility indicators only indicate the inherent volatility in the asset. They cannot be used on their own in determining whether to go long or short on an investment. Other indicators fulfill this purpose.
Each volatility indicator has its pros and cons. So, there are other volatility indicators that can be classified as reliable in forex trading.
See the under listed volatility indicators.
Average True Range
The Average True Range (ATR) indicates what the average trading range of an asset, an index, or a market would be in a specified amount of time.
In other words, if you want to check how many pips the EURUSD can potentially move in a day at any given day of the month, the ATR indicator clearly provides this information.
The ATR will look at the highest and lowest prices within the period under review, then plot the vertical distance between these two parameters as a moving average in its indicator window.
You can customize the period the ATR looks at.
The default setting is 14 (i.e. 14 days) on the MT4, but you can adjust this as you like.
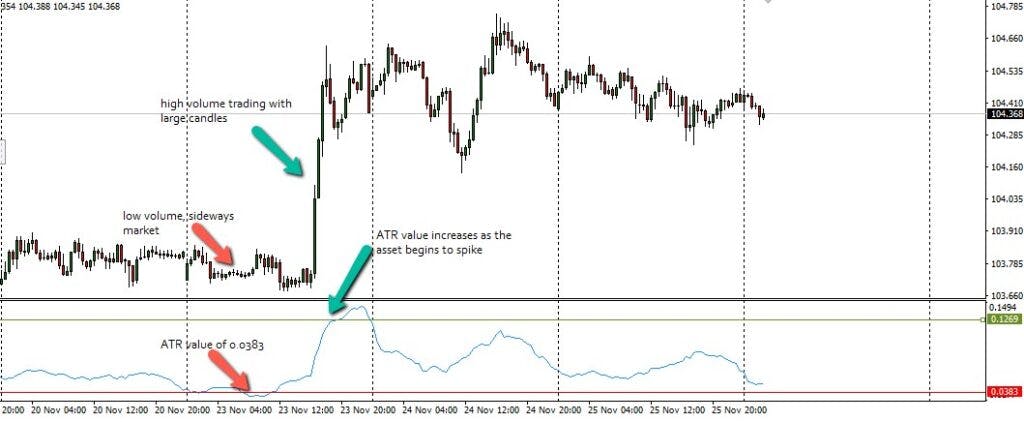
High ATR values signal that the volatility of the asset is rising. A declining ATF value signals reducing volatility, which is typically the case in a range-bound or sideways market with low volumes.
By looking at the ATR, a trader can immediately tell by how many pips the asset may move for the day, which helps in risk management as well as knowing how much profit to target when taking trades.
SEE ALSO: Master Price Action in Forex with these Simple Steps
SEE ALSO: Top 10 Best Forex Signals for New Traders
SEE ALSO: 10 Best Low-Budget Forex Courses on Udemy
Bollinger Bands
The Bollinger bands are arguably a much accurate volatility indicators to use. The Bollinger band indicator has three bands.
The outer bands (upper and lower Bollinger bands) tend to enclose 95% of the price range as these bands are plotted at a certain distance away from the middle band.
The middle Bollinger band is by default, a moving average that covers 20 days. The lower and upper bands are plotted at two standard deviations away from the middle band and tend to come together to produce the Bollinger squeeze when volatility is low. The bands widen greatly when volatility is high.
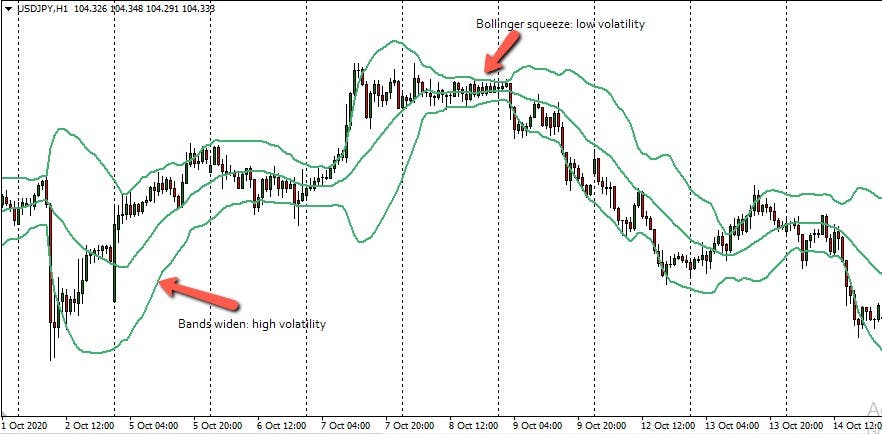
The Bollinger bands adjust automatically to changing market conditions, which is what the squeeze and expansion are the two essential characteristics of the Bollinger band indicator that are used to measure volatility.
SEE ALSO: Beginners Guide – 8 Day Trading Indicators for Currencies and Stocks
SEE ALSO: Best Times to Trade Gold with Small Capital
SEE ALSO: A Beginner’s Guide – How To Analyze 3 Types of Forex Charts
Final Thoughts
There are other volatility indicators such as the moving average, standard deviation indicators channels, etc.
However, these are indicators with multiple functions, and they are better known for other functions than for their core volatility functions.
Therefore, it is best to stick with these two volatility indicators as recommended for currency trading.


Read More