A stop loss is an order to buy or sell a financial asset when it gets to a set price known as the stop price. When a stop-loss order is triggered, the stop price will now be the new market order.
Stop loss is applied during a trade to minimize losses on investment in stocks, forex, derivatives, and other financial assets by mitigating massive price depreciation.
Stop loss can be applied at a buy or sell position known as the “Buy stop order” and ”Sell stop order”.
How do you set a stop loss order?
A stop loss can be placed on either the buy or sell side of a trade.
For example:
Mr. McGregor picks interest in ABC stock which sells at $12.00 per share.
Buy stop order
He instructs his broker to buy 3000 units of ABC stock if it falls to $10.00 per share and he then places a stop loss order to sell the stock if the price falls below $8.50. This means that Mr. McGregor is willing to limit his losses by $1.50 if the stock goes south.
Sell stop order
Three weeks after, the Chairman of ABC declares an impressive dividend payout to shareholders. Mr. McGregor’s is excited and anticipates a bullish run.
A few hours after the pronouncement, the stock gets bullish hitting a high of $14.50, Mr. McGregor calls his broker and instructs a sell stop order on his holdings at $16.00.
This means that If ABC shares hits his expected stop price, he will make a profit of $6. $16.00 will now be the new market order.
A stop loss order is used to minimize losses when prices of a financial assets continue to fall.
Traders are advised to use it given the fact that technical analysis is sometimes subject to questioning.
A margin of error which includes wrong predictions should be taken care of by setting a stop loss.
Even in recent times, many investors buy stocks at prices convenient for them and then they forget about it. Huge sums end up lost because they ignore the stocks hoping it will continually rise.
Some leave their investment decisions entirely to their broker without monitoring the trends.
Stock trading, forex, and other financial assets require close monitoring either in the short, mid, or long term.
SEE ALSO: 3 Types of Forex Orders and How to Use Them
SEE ALSO: A Beginner’s Guide – How To Analyze 3 Types of Forex Charts
Negative effects of a Stop loss
When a stop loss order is set and the stock falls or rise to the set stop price, the stop loss is triggered and a buy or sell order is executed.
Sometimes a stock can rise back sharply after touching the stop price and it continues to rise even above the set exit price of the investment.
Since the stop loss had already been set and triggered, the investor loses out of the potential gain he would have made.
To manage trades and avoid exiting prematurely, a stop loss limit order could be used instead. A Stop loss and a Stop limit order is similar but are not the same.
[table id=4 /]
Why should I use a Stop loss limit order?

A stop loss limit order is a tactic where two price points are set so that the trader can execute a stop at a preferable price. Usually a timeframe is predetermined before a stop loss limit order is set.
A limit order must have two price points with a clear differential in prices (Price point A and Price point B)
- Stop price point: Target a set price at the start of trade.
- Limit price point: Target an exit price beyond the set price as a measure of safety.
Stop loss limit gives a trader better control over his trades, ensuring he has at least two options to close his trade in case it goes against him.
Determining where to place a stop loss
A stop loss strategy guides a trader on the amount of risk he is willing to take. Targeting a near comfortable exit price is a determining factor. Unfortunately, some traders try to set a stop loss when currency or stock prices begin to fall uncontrollably.
Traders are encouraged to set a stop loss before initiating a trade in order to avoid closing a trade after surpassing a realistic stop limit. Another important metric is the stock or currency’s historic price trend, Day high and Low peculiar with forex day traders and Year high and low mainly in stock trading.
Beyond the investor’s capital and size of portfolio, historic price trend is a valid key indicator.
If ABC stock is trading at $12.00 and in the last five years, it has never risen to $30.00, the chances that it will get to the anticipated price is unlikely to happen. Unless a major company-wide overhaul, merger or acquisitions happens then, there could be a possibility.
An investor with interests in ABC shares should check for year high and low prices within a time frame, half year, two years etc. This will give a range or realistic expectation on the highest price the stock can get to.
SEE ALSO: 6 Psychological Pitfalls of Trading the Forex Market
Stop Loss Placement Methods
Moving Averages
Moving averages (MA) help traders smoothen day to day price fluctuations. MA is a component of technical analysis used to analyze data prices and calculate a set of average prices from a given data.
This eliminates undue price fluctuations and lowers unpredictability. There are two types of Moving averages, the Simple Moving average, and Exponential Moving average.
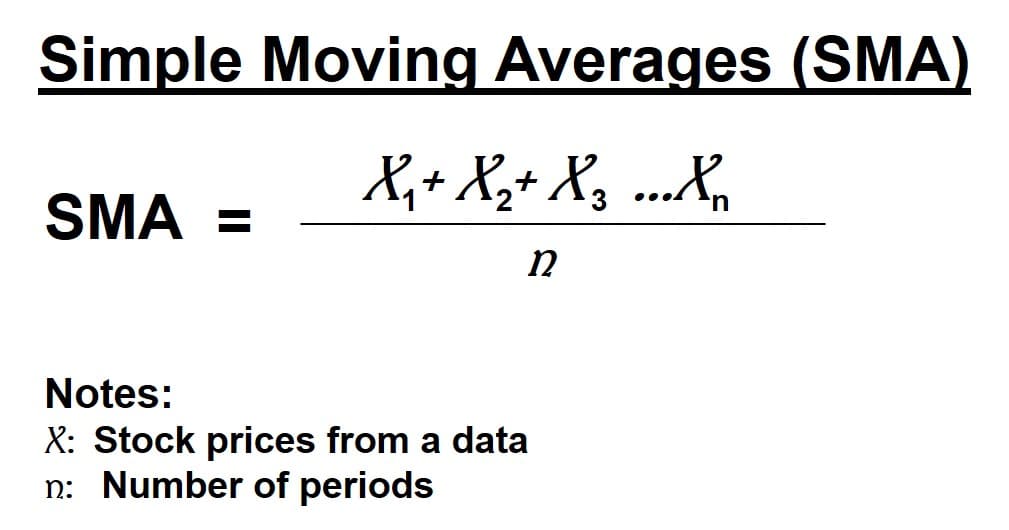
Simple Moving Averages (SMA)
This method considers the arithmetic mean of a set of stock prices while factoring in a specified period in days say last 10, 15. 30, 60 days. How to calculate SMA is by adding the prices and dividing it by the number of periods.
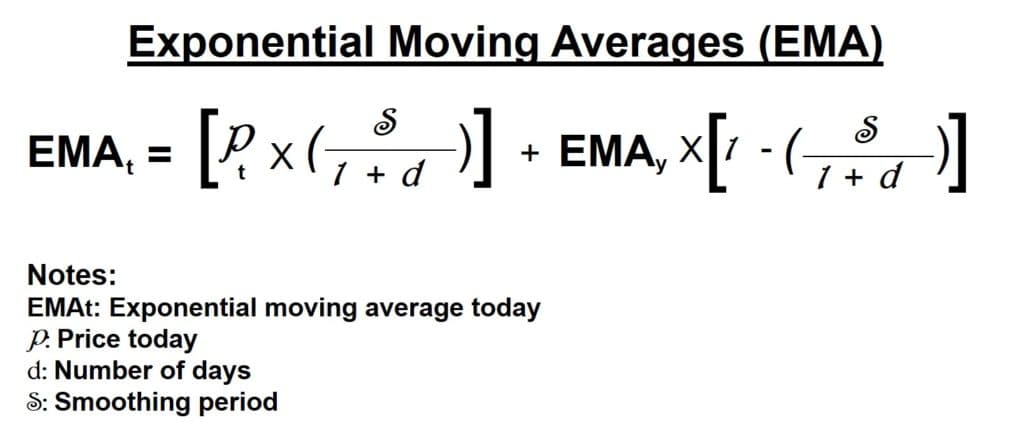
Exponential Moving Averages (EMA)
This method takes moving averages a step further by assigning weights to a set of prices with an emphasis on the most recent set of prices. The EMA gives clearer information on the prices of the stock from a recent perspective.
Percentage method
A percentage of the price point is set as the stop loss. For example, an investor instructs his broker to set a stop loss for ABC shares at 15% below the entry price.
Assuming the stock was bought at $10.00, it, therefore, means that the stop-loss order will be triggered at $8.50 for a possible sale. This makes it clear how much a stock portfolio is gaining or losing in percentage terms.
Support method
When the price of a stock moves along a trajectory, it trails along representing a support and a resistance point on the chart.
The support is the point where a downward trend is expected to stop due to strong buyers’ interest and demand for the stock. At this point, the investor then sets a high entry price below the support level.
Key Take Away
Traders should predetermine trading limits ahead of trades. Choosing a price level that is most convenient depends on each trader, strategies and risk tolerance.
The bottom line is to set a stop loss before trading as this would avert costly errors and minimize the risk of loss of capital. Stop-loss methods have their varying applications depending on the nature of technical analysis you’re considering.
Stop-loss still remains a critical and valuable aspect of trading and should be taken seriously.
We wish you a successful trading!
Image credit: Business vector created by freepik – www.freepik.com


Read More