Numerous theories try to explain why financial markets work the way they do. An important part of them seeks to analyze the psychological aspect of the behavior of traders and explore how the mentality of individuals affects the general trend of the market.
The most popular among them is the century-old Elliott Wave Theory. In this guide, we will focus on the concept of Elliott Waves, their main advantages and disadvantages, how to use the patterns, and we will look at some real-life examples to see how the theory works in practice.
Key Takeaways
• The Elliott Wave theory was shaped in the 1930s by Ralph Nelson Elliott. The concept was introduced in the book “Wave Principle”, published in 1938 and summarized in a series of articles in the Financial World magazine in 1939.
• Elliott Wave theory shares key similarities with Dow theory, which also looks at price movements as waves. However, Elliott’s theory goes deeper by introducing the idea of the fractal nature of markets.
What is Elliott Wave Theory?
Elliott Wave theory is based on the idea that stock markets and instrument prices move in repeating patterns. These patterns are correlated with crowd psychology and the way investors perceive external factors. The constant repetition of these patterns is called “waves.”
Traders use the Elliott Wave principle to analyze market cycles, entry, and exit points of time, and identify potential extremes.
The concept runs counter to the idea that financial markets are chaotic and dominated by randomness. In fact, it assumes that everything is rational and can be explained by the behavior of market participants.
History of the Indicator
The Elliott Wave theory was shaped in the 1930s by Ralph Nelson Elliott. The concept was introduced in the book “Wave Principle”, published in 1938 and summarized in a series of articles in the Financial World magazine in 1939.
It was covered extensively in Elliot’s main work, called “Nature’s Laws: The Secret of the Universe.” Or, The Laws of Nature: The Secret of the Universe, published in 1946.
Although it was denied at the time in the context of lacking “scientific evidence,” later the Elliott Wave theory became a key pillar of understanding and a fundamental principle for a whole set of traders.
Elliott Wave theory shares key similarities with Dow theory, which also looks at price movements as waves. However, Elliott’s theory goes deeper by introducing the idea of the fractal nature of markets.
Fractal – an endless pattern that repeats continuously. Fractals are infinite, which in the context of Elliott Wave theory means that prices will set in waves as long as the markets function.
The Pack Mentality
A cornerstone of Elliott Wave theory is the so-called “herd mentality.” The concept suggests that large groups of individuals tend to affect the way of thinking and acting of each one on a personal level.
A typical characteristic of the herd mentality, or herd, is that individuals rarely take responsibility and, rather than making their own decisions, are more willing to seek the way the group operates. In other words, individuals are more willing to follow than lead.
The truth is that the herd mentality is not a new phenomenon. It had been around for decades and was the subject of a variety of different scientific investigations.
“Men think in packs and go crazy in packs, while only slowly regaining their senses, one by one.” – Charles Mackay, “Extraordinary Popular Delusions and the Madness of Crowds,” published 1841.
According to studies, the herd mentality can be found in all aspects of life that involves a large group of people, including fashion, family, financial markets, and more.
In the context of financial markets, Elliott Wave theory attempts to forecast the price of instruments based on the repeatable patterns created by the herd.
Every aspect in which the herd mentality is present is often perceived as easier to predict, with repeating patterns.
Understanding Elliott Wave Patterns
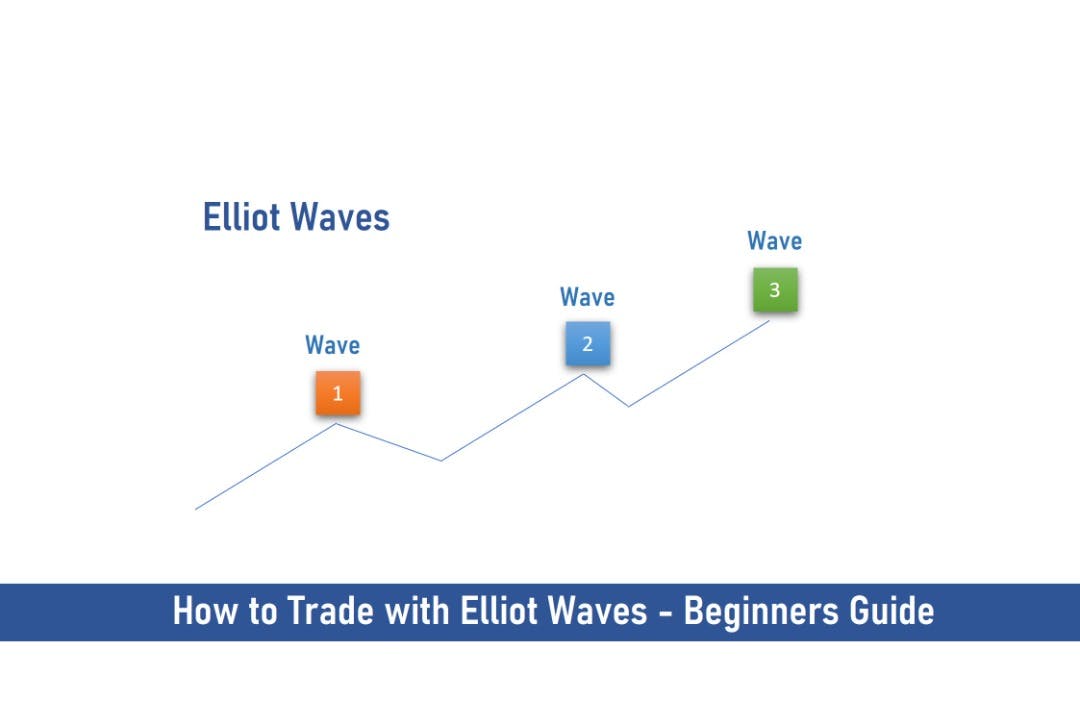
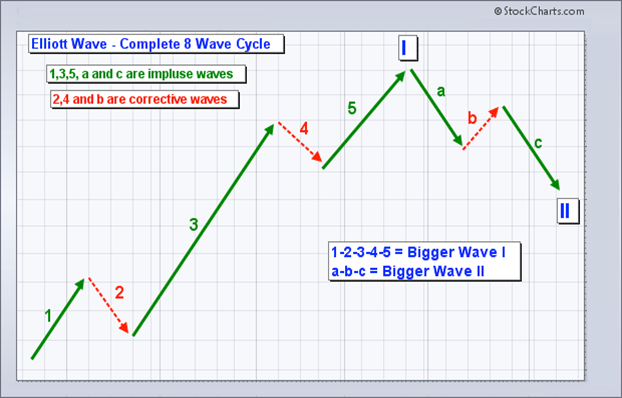
Elliott Wave theory is based on the concept of impulse waves and corrective waves.
The idea is that each price movement that goes in the direction of the trend consists of five smaller waves. Some traders also refer to these smaller waves as “impulse waves”.
The same is true for corrections, with the main difference that each price correction consists of three waves, known as “corrective waves”.
Each impulse, or corrective wave, contains five or three smaller ones within its pattern. Each of these smaller waves in the pattern consists of five or three other waves, and so on.
The process is infinite, since the waves are part of a fractal.
Simply put, Elliott wave fractals are basically Elliott waves within Elliott waves.
Simply put, movements in the direction of the trend take place in five waves. Meanwhile, the corrections against it unfolds in three waves.
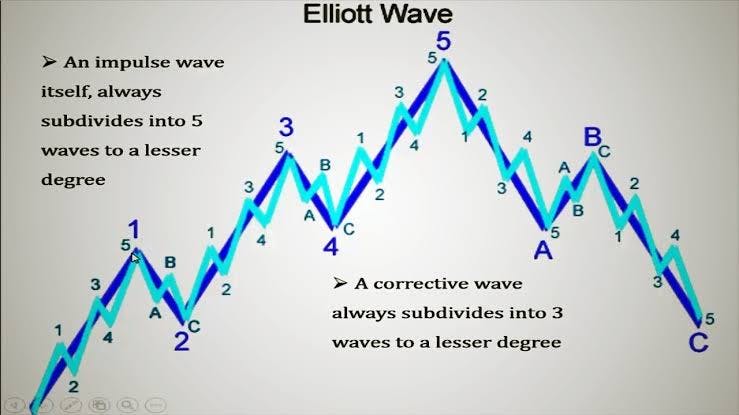
In the chart above, the movement in the direction of the trend is labeled with numbers (1, 2, 3, 4, and 5). The move against the trend is labeled with letters (A, B, and C).
Let’s Take a Closer Look
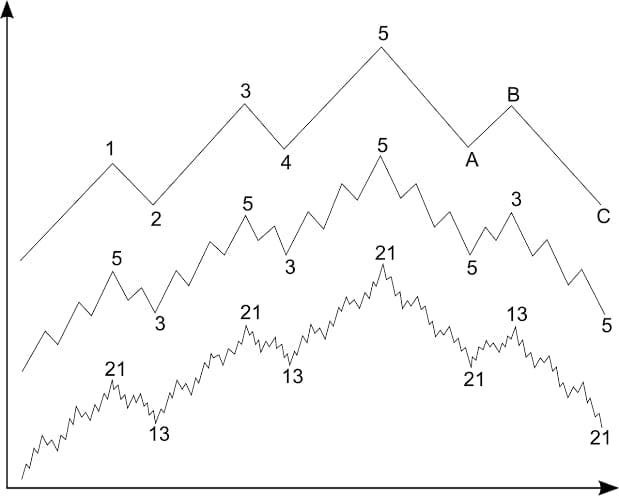
Let’s analyze the figures in a little more detail. In the example above, we have three graphs. Let’s start with the first one (the one above).
We can see that in the first sequence of five waves, waves 1, 3, and 5 are motor (impulsive). Meanwhile, waves 2 and 4 are corrective (or go against the trend).
This sequence indicates two things: first, that the trend is upward. Second, the beginning of a three-wave corrective series is just around the corner.
In the second (middle graph), we see that after the entire sequence of eight waves ends, it begins again and repeats indefinitely. The last graph displays a complete pattern, consisting of 89 impulses and 55 corrective waves.
These patterns are present in both short-term and long-term charts but are best visualized on the latter.
Let’s analyze the momentum (motivate) patterns in detail to find out how to interpret each wave within the dominant trend and what to expect in terms of prices and economic performance:
Wave 1
As with most technical indicators, the early part of their training is very difficult to interpret and is rarely obvious. In an uptrend, wave 1 is usually accompanied by negative market news. That’s because the strength of the previous trend has yet to fully fade.
During the first wave, you should expect estimates from low earnings reports, bearish sentiment surveys, moderate to high volatility, and generally negative economic forecasts.
Wave 2
Wave 2 is a corrective wave that reminds you of the recently dominant uptrend. However, it is worth noting that the second wave cannot get past the starting point of the first. Otherwise, the pattern will break.
During the second wave, the news on economic performance remains bad and prices retest the previous lows. There is an accumulation of negative sentiments and prevalence of investors with bearish views. However, things are slowly starting to improve.
Wave 3
Wave 3 is very decisive. In most cases, it is the largest and most powerful of the entire trend (except in commodity markets, where the largest wave is usually number five).
During and after the midpoint of wave 3, most of the news starts to turn positive and the effect of the previous trend has usually almost completely faded.
This stage is accompanied by rising prices, positive earnings report projections, and economic forecasts, bullish dominance, etc.
A general rule of thumb is that wave three exceeds wave one by about 1.618: 1.
Wave 4
Wave 4 is the second corrective wave in the sequence. Prices here can move sideways, and you should expect the wave to recede to less than 38.2% from the previous one. We can also associate wave four with a lower volume than wave three.
Don’t be nervous if things don’t seem to be progressing during wave four. This is typical of a particular wave, and once it is over, things will go back to normal.
Wave 5
Wave 5 completes the pattern in the direction of the dominant trend. All news and sentiments are firmly bullish, the volume is lower than wave 3, and prices are starting to hit new highs.
This is generally not the best place to shop as the trend will be reversing soon (unless you act quickly and ride only wave 5).
Most traders try to buy on the third wave or combine it with other indicators to get more confirmations.
The Counter-Trend Movements
Now let’s focus on the corrective trend and analyze the three waves to find out what to expect and how to interpret them:
Wave A
Keep in mind that corrective waves are usually a bit more difficult to identify compared to impulse waves.
When the market is bearish, the news coming out during wave A is mostly positive as analysts have yet to find out if there is a correction or if the bull market is slowing down.
During wave A, you can expect higher trading volume and relatively stable prices.
Wave B
Here you can expect prices to reverse higher. This can trick you into assuming a possible continuation of the bull market.
However, be sure to take a look at the trading volume. During wave B, it should be lower than during wave A.
Also consider the upcoming news, as the positives should be waning, and there should be initial signs of slightly bearish sentiment.
Wave C
This is the most significant confirmation of the bear market. Wave C is usually as large as wave A and can also extend up to 1.618 the first wave.
Wave C is usually accompanied by an increase in trading volume.
How Can You Use The Elliott Wave Patterns?
The truth is that, for traders, Elliott Wave theory is one of the most difficult tools to use. Although easy to learn on paper, when it comes to real trading, many people give up sometime along the way as they struggle to implement theoretical knowledge in real life.
To avoid falling into this situation, the most important thing is to start from the basics. With the Elliott Wave theory, there are three crucial rules to understand.
These include:
1. The typical retracement of wave 2 is between 50%, and 61.8% of wave 1, but never more than 100%.
2. Wave 4 usually falls between 38.2% and 50% of wave 3, but never more than 100%.
Wave 3 normally extends wave 1 by a ratio of 1.618: 1 and always travels past its end. It is never the shortest.
Before proceeding to see how we can apply them when trading, it is essential to note that the Internet is full of tutorials on how to use Elliott Wave theory.
You can find everything from the basics to advanced tutorials and professional videos. However, in the end, it all comes down to one thing, figuring out which is the best waves to enter a trade.
Putting it Into Practice
Years of practical application have made it clear that the best two to get into a trade are usually corrective waves 2 and 4. Great, but which one exactly?
If you combine the theory with other indicators such as MACD or RSI, which can confirm that the time to enter a trade is right, then you can do it during wave 2. Over time, as you gain more experience, you can take momentum as soon as it arises.
However, if you are inexperienced or receive mixed signals, be sure to wait for wave 4. It generally follows the longest wave in the sequence (number 3) and makes traders more confident in their decisions.
Some traders wait for the beginning of wave 5 formation to open their position. During wave 5, there is no question in the direction of the market, so it is often viewed as a win-win situation.
However, if you decide to wait for round 5, you need to make sure you act quickly. The reason is that you are basically riding the last wave before the correction.
You can also apply reversal strategies during corrective waves (A, B, and C). However, things get more complicated here, and if you’re just starting out, make sure to avoid trading after wave 5.
So, simply put, no matter the entry point, the exit point is usually within wave 5. Once you recognize that you are riding wave 5, make sure you start considering taking your profits (at least a part of them) and focus on the stop loss to lock in your remaining profit.
Frequently Asked Questions (FAQ)
1. Which Time Frame is Best For Elliott Wave?
In theory, Elliott wave patterns are fractal and should apply to any time frame. Therefore, the “best” time frame to use is the one you’re most comfortable trading. If you’re a day trader, you may use one-minute, five-minute, or one-hour candles.
2. Can You Day Trade With Elliott Wave?
Day traders use Elliott Wave Theory to make predictions about upcoming price action. Since Elliott Wave Theory predicts repeated on-trend waves, periodic counter-trend waves and successively smaller wave-sets, it can be used in a wide variety of ways to create effective trading positions based on resulting predictions.
3. How Are Elliott Waves Measured?
The price distance of each wave is measured as a vertical distance from the beginning of the wave to the end of the wave. The length is measured in price points or units.
In the examples below, the length of each wave is indicated by the length of its corresponding arrow.
Final Thoughts
Traders use the Elliott Wave principle to analyze market cycles, entry, and exit points of time and identify potential extremes hence this seems like a promising theory you should learn if you want to have a deeper analysis concerning the happenings of the forex market.


Read More