Scalping in Forex trading is simply a technique of profiting from a small price differential when trading a currency pair. Scalping is also a day trading strategy that requires market volatility to become profitable.
It’s important to know that there are five types of technical indicators widely known to be great for scalping.
Technical Indicators for Scalping
They are:
- The Simple Moving Average Indicator,
- The Exponential Moving Average Indicator,
- The Average Convergence Divergence Indicator,
- The Parabolic Stop And Reverse Indicator, And
- The Stochastic Oscillator Indicator.
In this article, we’ll discuss 5 types of Forex Scalping.
For each type, we’ll provide — a simple explanation of what are the merits, and demerits.
SEE ALSO: 5 Best Scalping Forex Robots for MT4
SEE ALSO: Breakout in Forex Trading Simplified
The Simple Moving Average (SMA) Indicator
The simple moving average indicator is very popular in scalping the Forex market.
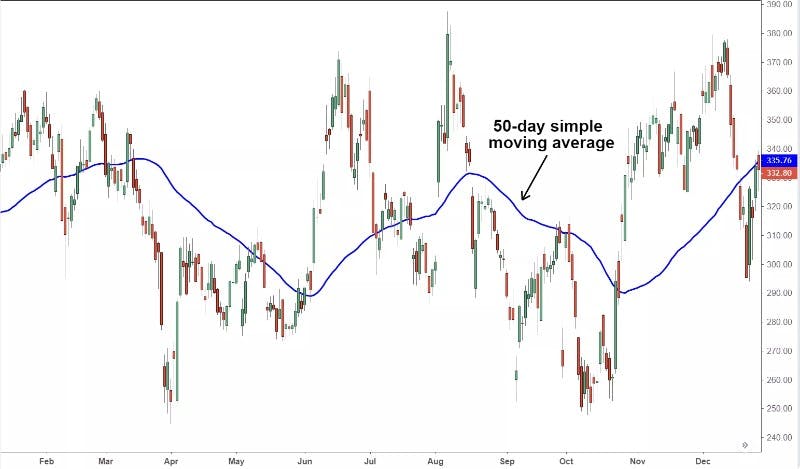
The indicators are like standard currency pair line charts, but they are additionally clean. Noises are absent or minimal in them.
A “noise” is simply a set of changes in price direction that do not matter in a long-term view.
In other words, an SMA indicator is like a polished version of a standard price chart. With a polished chart, almost every change in price direction can be used to make good buy or sell decisions.
A simple moving average indicator is created by using a calculated price for each time on the chart it is being created from.
The calculated price is got by calculating the average of the time’s actual price and some older prices. For instance, if the following are the prices of the EUR/USD pair for last week —
| DAY | PRICE | |
| 1 | Sun | 1.20290 |
| 2 | Mon | 1.20296 |
| 3 | Tue | 1.20298 |
| 4 | Wed | 1.20294 |
| 5 | Thur | 1.20300 |
| 6 | Fri | 1.20298 |
| 7 | Sat | 1.20306 |
…if we are to create a simple moving average chart for the weekdays of that week, our data may look like the following —
| DAY | PRICE In this case, a day’s price will now be the average of the actual day’s price and the previous day’s price. | |
| 1 | Mon | (1.20296 + 1.20290) / 2 = 1.20293 |
| 2 | Tue | (1.20298 + 1.20296) / 2 = 1.20297 |
| 3 | Wed | (1.20294 + 1.20298) / 2 = 1.20296 |
| 4 | Thur | (1.20300 + 1.20294) / 2 = 1.20297 |
| 5 | Fri | (1.20298 + 1.20300) / 2 = 1.20299 |
The Merit
To succeed at using a technical indicator, you have to understand it, you shouldn’t just know how to use it. So since the SMA is easy to understand compared to the other types, its ease of understanding can be considered a merit.
The Demerit
The major demerit of the simple moving average indicator is that it doesn’t always do its job with good accuracy. At times, it under-eliminates noises and at times it over-eliminates noises.
The Exponential Moving Average (EMA) Indicator
The exponential moving average indicator is similar to the simple moving average indicator. It eliminates noise from the chart of a currency pair, making it easier and safer to know when to buy and when to sell.
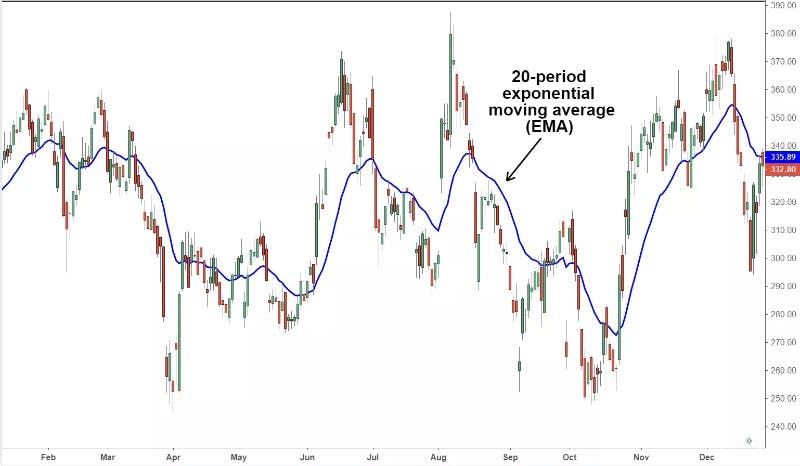
However, unlike the SMA, the EMA doesn’t have noise under-elimination or over-elimination issues. Even when you experience such problems, they are often not bad.
The Merit
The merit of the exponential moving average has already been stated. It eliminates noises better.
You’ll hardly experience things like poor noise elimination and exaggerated noise elimination. Even when you do, they are hardly bad.
The Demerit
You not only have to know how to use an indicator, but you also have to understand it.
But unfortunately, understanding the exponential moving average indicator takes some effort. In other words, some people may consider it difficult to understand.
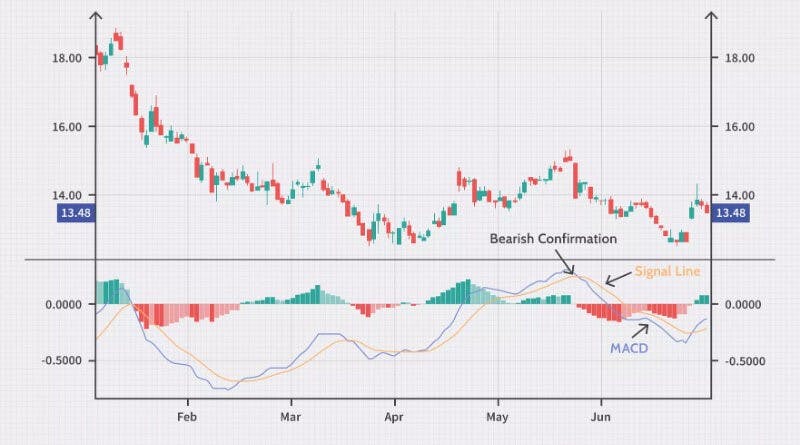
The Average Convergence Divergence (ACD) Indicator
The average convergence divergence indicator is like combining the simple moving average indicator and the exponential moving average indicator into a single indicator.
You may wonder, why use the SMA at all, when the EMA is kinda like a better EMA?
Well, even though the EMA is like a better SMA, the SMA has some situations where it can be very helpful.
So by combining the two, you’ll be getting the best of both tools in a single indicator.
Although the ACD is like combining the SMA and the EMA into a single tool, it doesn’t seem so superficially.
On the surface, the ACD looks very different, but when you look at it fundamentally, it’s just as I explained.
The Merit
The merit of the average convergence divergence indicator is that it is more powerful than the other types we’ve discussed.
If you can learn and understand it, you’ll be able to make better trading decisions. Not only will your chances of losing trades greatly decrease, but your wins will also be bigger.
The Demerit
The demerit of the average convergence divergence indicator is that understanding it takes a lot of effort.
It takes even more effort than understanding the exponential moving average indicator.
SEE ALSO: 7 Best Currency Pairs to Trade for Beginners
SEE ALSO: What are the Best Days of the Week to Trade Forex?
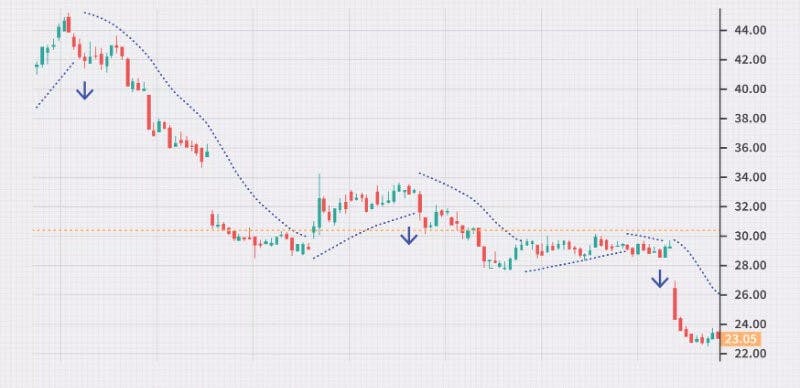
The Parabolic Stop And Reverse (SAR) Indicator
Making better trades is usually our aim for using technical indicators. The 3 types I discussed above try to achieve this by showing clean (noiseless) price trends.
For the parabolic stop and reverse indicator, it tries to achieve the aim differently.
The parabolic stop and reverse indicator try to achieve the aim by letting you know (suggesting) when to buy and when to sell.
The Merit
The parabolic stop and reverse indicator, when used alone, isn’t special, but when combined with other tools, it makes a huge difference. That is its merit.
The Demerit
The demerit of the parabolic stop and reverse is that understanding it demands a significant amount of effort.
The Stochastic Oscillator (SO) Indicator
The stochastic oscillator indicator helps scalpers to succeed, by showing them the rate of change of a currency pair.
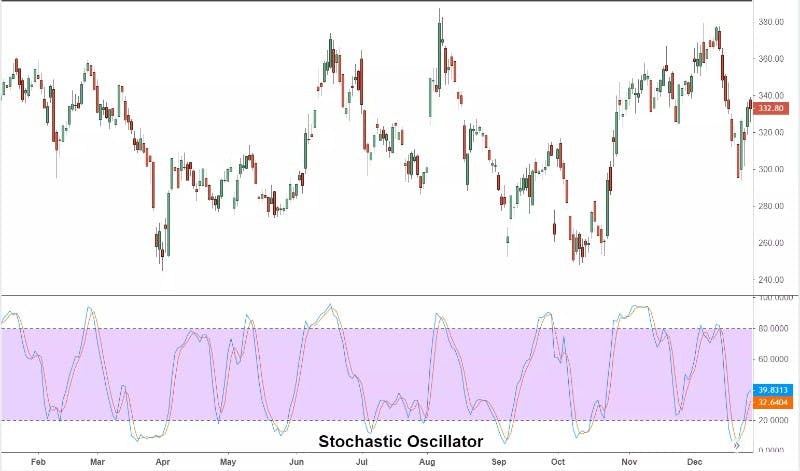
Note “rate of change”, not “change”. The difference is that indicators like the SMA say things like — “The price for the EUR/USD pair was 1.23400 on Monday, 1.233778 on Tuesday, etc.”, but in the case of the stochastic oscillator indicator, it says things like — “The EUR/USD pair increased in price by 56-per-cent on Monday, 51-per-cent on Tuesday, etc.”.
By knowing the rate of change of a pair, it becomes easier to know the best time to sell, to maximize profit.
Note that the stochastic oscillator indicator isn’t meant to be used alone. It is meant to be used complementarily.
The Merit
The major merit of the stochastic oscillator indicator is that it will generally help you sell at higher prices.
The Demerit
The demerit of the stochastic oscillator indicator is that if used wrongly, it can be dangerous. So before setting out to use it, make sure you have a great understanding of it.
Final Thoughts
The types of technical indicators discussed in this content can make you very successful at scalping.
However, before using, make sure you understand them very well — know the principle behind them, know why they were invented, etc. Using them without a good understanding can be costly.


Read More