Support and Resistance Indicator levels illustrate how the forces of supply and demand interact to determine the going price of an underlying asset.
Key Takeaways
•The price of financial assets is determined by the forces of supply and demand, just like in any other commercial market.
•The basic trading strategy in the market is to buy an asset when prices are at the support level and sell when prices are at the resistance level.
•It is important to note that support and resistance levels are not exact prices, but rather areas where demand and supply may change.
Support and Resistance in a Nutshell
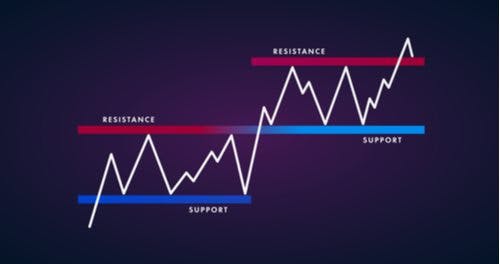
The price of financial assets is determined by the forces of supply and demand, just like in any other commercial market. In financial markets, it is the support and resistance levels that accurately illustrate how the forces of supply and demand interact to determine the going price of an underlying asset.
Prices usually rise until supply exceeds demand and this is the point of resistance, where prices will start to fall. Likewise, prices will fall until demand exceeds the supply and this is the point of support, where prices will start to rise.
The basic trading strategy in the market is to buy an asset when prices are at the support level and sell when prices are at the resistance level.
It is important to note that support and resistance levels are not exact prices, but rather areas where demand and supply may change. Support and resistance levels are closely watched by market participants, who are all keen to take advantage of opportunities that may arise when supply or demand changes.
Types of Support and Resistance
1. Fixed Support and Resistance Levels
These are support and resistance levels, which are fixed and cannot change. They will only be canceled if the prices manage to exceed or fall. Psychological and sentimental levels, such as round numbers or previous significant price levels (such as historical highs and lows), are examples of fixed support and resistance levels.
For example, in stocks, round numbers, such as $ 100, can provide support or resistance to the price of an asset. As commodities trade, rates such as $ 2,000 for the price of gold can be seen as a support or resistance level.
2. Dynamic Support and Resistance Levels
As the name suggests, these are support and resistance levels that change as price and time change. These levels imply that prices are subject to new forces of supply and demand. Technical indicators, such as moving averages and Bollinger Bands, create dynamic support and resistance levels as price and time change.
3. Semi-Dynamic Support and Resistance Levels
Semi-dynamic support and resistance levels also change as time and price change, but they change at a fixed or predetermined rate. Some of the indicators that draw semi-dynamic support and resistance lines are trend lines, the Fibonacci tool, and pivot points.
These indicators draw support and resistance lines that change methodically as time and prices change.
How to Find Support and Resistance Levels
Here are some ways to find support and resistance levels in the markets:
1. Peaks and Troughs
This is the easiest way to plot support and resistance levels. Simply mark the highs and lows visible on your chart; Higher highs and higher lows will serve as resistance levels, while higher lows and lows will serve as support levels. It is always recommended that these lines are marked over longer time frames to have reliable support and resistance levels.
2. Fibonacci Levels
The Fibonacci indicator can be used in two ways: Fibonacci retracements help traders identify the best entry points when a trending market retraces; while Fibonacci extensions help traders identify the most optimal target points of a trending market.
In an uptrend, Fibonacci retracement lines will act as support lines, while in a downtrend, they will act as resistance lines. On the other hand, Fibonacci extension lines will act as resistance lines in an uptrend and support lines in a downtrend.
3. Pivot Points
The Pivot Points indicator uses the opening price, high, low and closing to mathematically derive several lines that serve as levels of support and resistance on the market.
The indicator plots 7 lines: 1 pivot point (PP), 3-support lines (S1, S2, and S3) and 3 resistance lines (R1, R2, and R3). If a support line is crossed, it turns into a resistance line, and vice versa. For example, if there is an uptrend and the price of the asset breaks above R1, the line will now serve as support.
SEE ALSO: Trend Trading: The 4 Most Common Indicators and How to Use them Effectively
4. Trend
Trend lines are the basis of technical analysis and can help traders trade with the trend. In an uptrend, a trend-line is drawn from a particular low, connecting other higher lows and projecting the line into the future. The line then acts as a semi-dynamic support line.
Best Support and Resistance Indicators for MT4
1. Fibo Machine PRO
The operation of this indicator is based on the mathematical Fibonacci sequence, which allows you to find the consistency pattern in the price policy of the stock exchange, more precisely, in the location of support and resistance levels. On the graph, their values are displayed as continuous or dashed lines.
Each of them displays existing calls to action – trade entry, stop loss level and maximum profit corridor. All this data is signed and displayed on the screen. Information about trends is also displayed in the upper left corner. This indicator is considered the best in its category and allows even beginners to make profit.
2. KG Support and Resistance Indicator
The current indicator allows you to build resistance (support) levels based on the high and low prices during trading. In the zones of the largest and smallest values, a small line is drawn to the right of the peak.
The algorithm is considered the best for finding axis breakouts. In the settings, you can only change the color of the lines. A special formula is used to determine peaks and breakouts, so access to additional settings is closed.
3. MTF Resistance Support Indicator
The algorithm is similar to Kg Support and Resistance but supplemented with the option to change the time intervals for deeper analysis. You can display 3 timeframes on the chart at the same time. Levels are built according to fractals.
The settings contain:
- Detailed information about levels and their options
- Function of automatic selection of parameters;
- Shows the points of formation of zones;
- Data of all 3 intervals for which the graph is built.
How to Trade with this Indicator
Here are some of the trading strategies using support and resistance levels:
1. Range Trading
This is a strategy for trading in sideways or linked markets. These are markets that do not have a clearly defined trend.
This is a strategy for online trading in sideways or linked markets.
These are markets that do not have a clearly defined trend and prices tend to oscillate between the areas of support and resistance. The basic idea in a market linked to a range is that there is a visible high where the rising price will face resistance and fall and a visible low where prices will find support and rise.
So the strategy is to look for buy trades when prices are close to the support level and sell trades when prices are close to the resistance level.
2. Breakout Trading
The support and resistance levels do not hold the price hostage. This means that they can be violated. Prices usually break after an extended period of consolidation, which gives traders plenty of opportunities.
A breakout is usually the start of a new trend, which means that traders have the opportunity to outperform an entire trend from its very beginning.
When the price breaks a support line, it implies that a downtrend is now in place and traders should be looking to place sell orders; whereas a breach of the resistance line implies that an uptrend is in place, and traders should look to place buy orders.
Frequently Asked Questions (FAQ)
1. Which Indicator is Best for Support and Resistance?
- Fibonacci Support and Resistance.
- Wolfe Waves.
- Camarilla Pivots.
- Murrey Math Lines (MML)
- Admiral Pivot
2. Which Time Frame is Best for Support and Resistance?
All time frame is good for support and resistance. It depends on which type of trader you are.
3. What Tool is Used for Support Resistance?
The Fibonacci retracements.
Final Thoughts
Knowing more about Support and Resistance Indicator For MT4 is a huge plus for full-time traders. But don’t be overconfident. Indicators often lag, so it is necessary to use other essential tools of your trading platform. Try to incorporate the signals from this indicator into your current strategy.
Focus on your past trading results and find a way to keep things simple by using the Support and Resistance Indicator for MT4. While this is a powerful tool for trading the Forex market, you still need to be careful with the execution process.
Never get biased or excited with this tool, instead think of it as your help.


Read More